

Analyze 2.0
We are pleased to announce an update to our Analyze feature. This update brings significant enhancements to how you interact with AI-driven summaries and deepens your understanding of company fundamentals and regulatory filings.
- Enhanced summaries: We've improved the AI context window, enabling more accurate and contextually relevant summaries that help you make better-informed decisions.
- New User interface: Analyze is now partitioned into two distinct tabs: Fundamentals and SEC Filings, making navigation more intuitive and information more accessible.
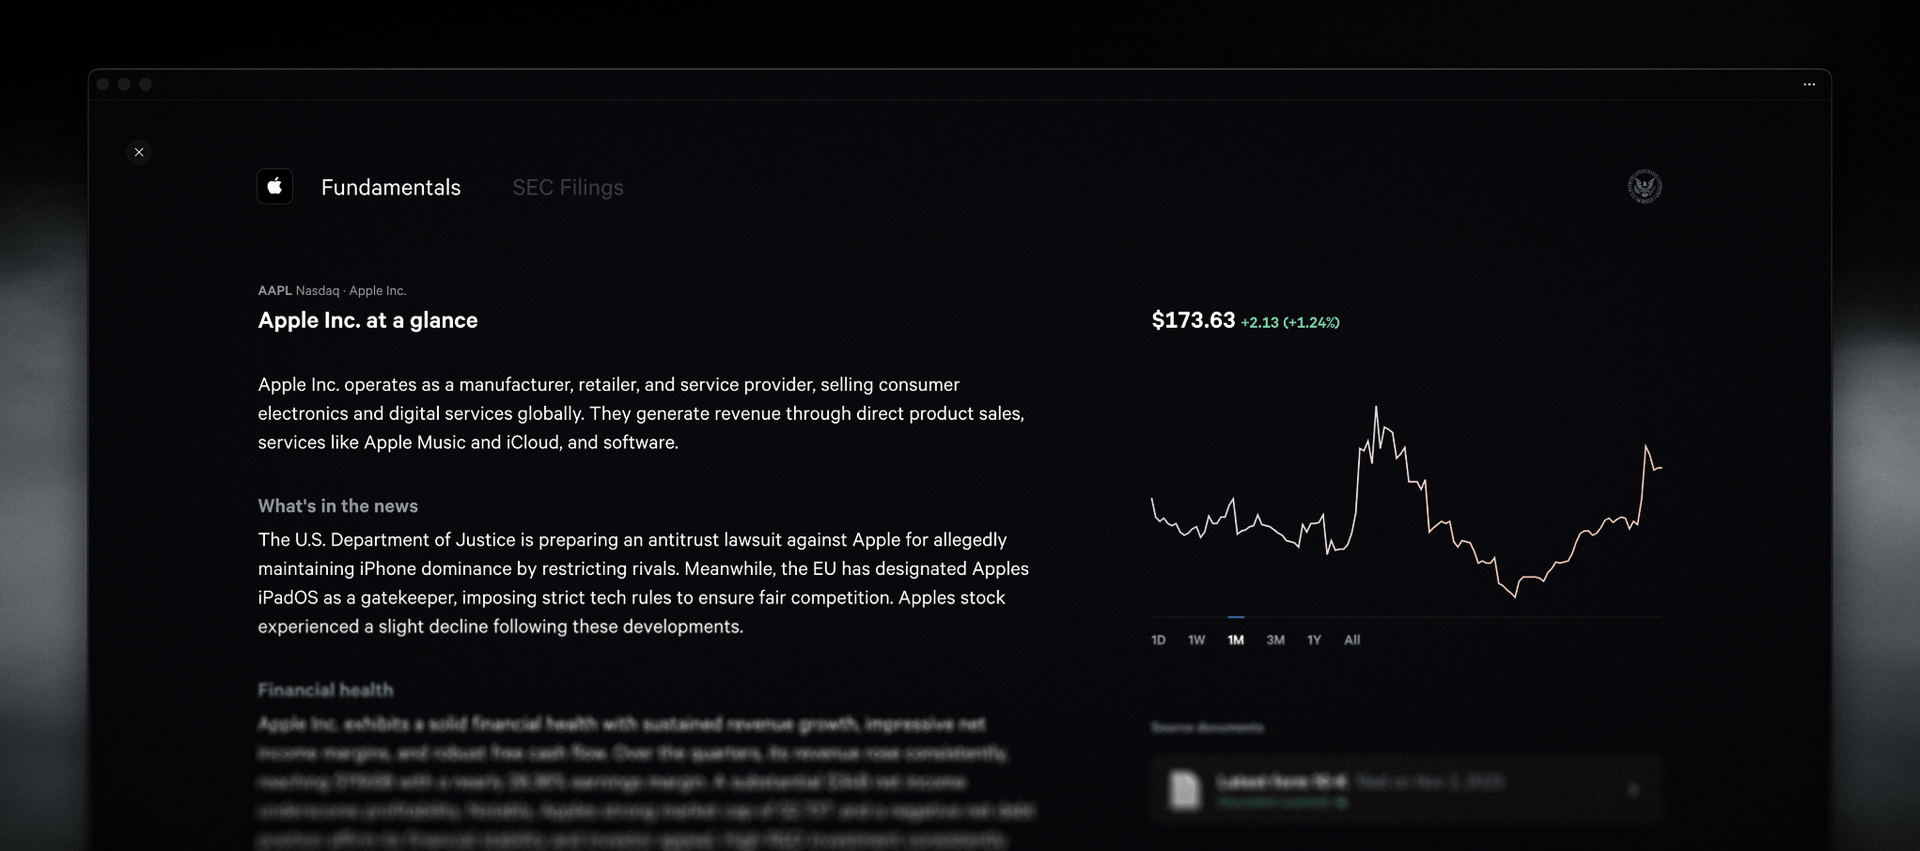
Fundamentals
The Fundamentals Tab offers a comprehensive overview of a company’s operational and financial standing. It includes a quick snapshot in the Overview, insights into how the company makes money, dynamic updates on the latest news, key financial metrics to assess financial health, a summary of potential risks and challenges, and the latest opinions and ratings from financial analysts.
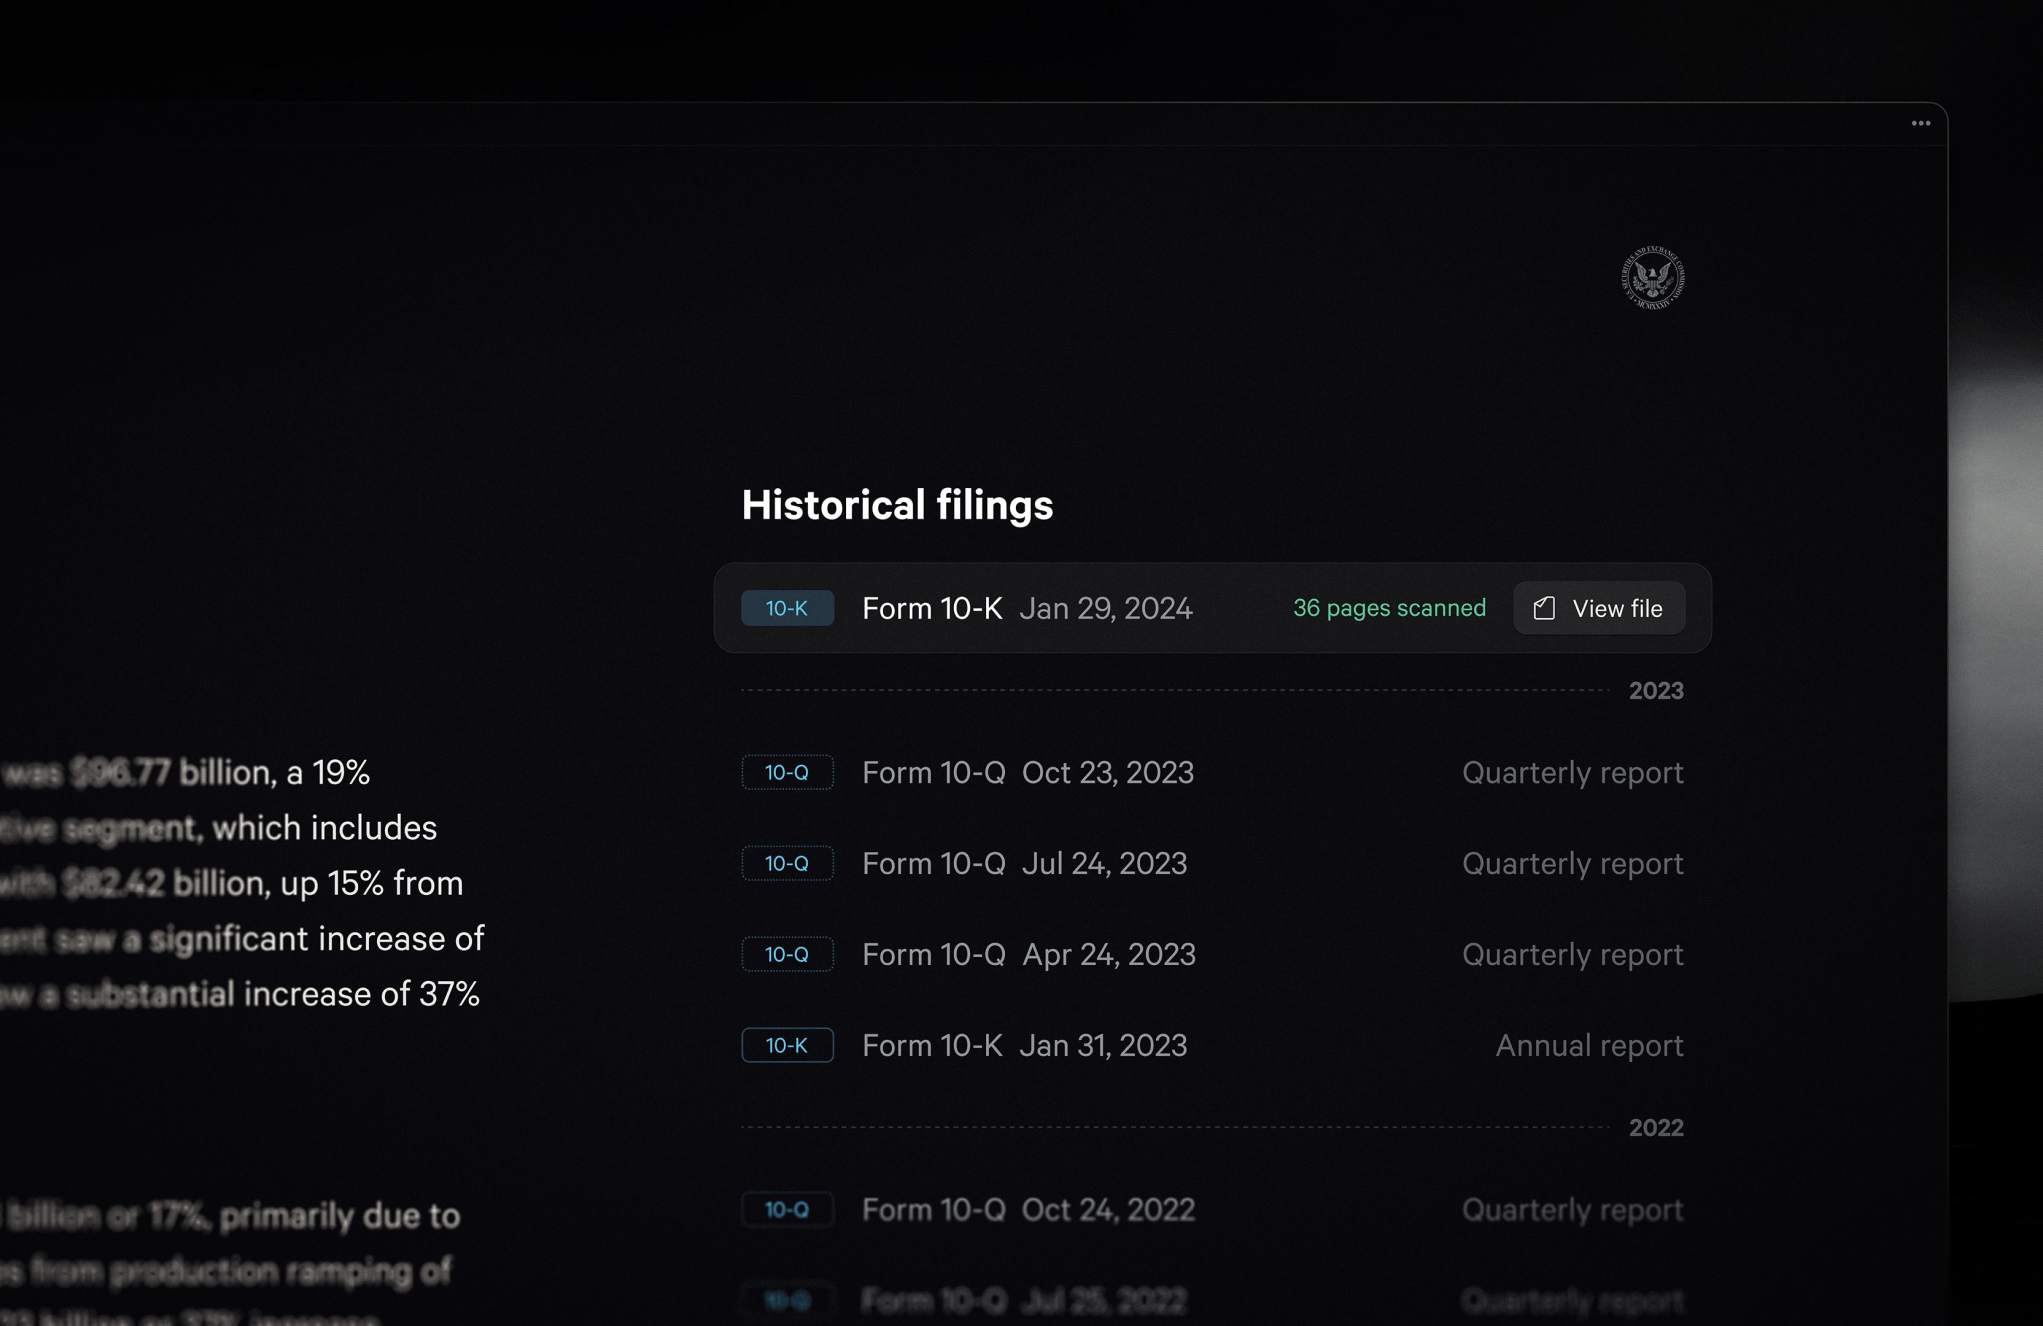
Historical SEC Filings
In the SEC Filings Tab, users can find a structured and simplified view of regulatory filings. This tab allows for easy access to historical SEC filings, providing a backdrop of the company’s regulatory history. Additionally, it features on-demand summaries of annual and quarterly reports, such as Forms 10Ks and 10Qs, which highlight key information and save time.
These enhancements are designed to provide you with a richer, more informative experience. We invite you to explore Analyze 2.0 and see how these new features can assist in your analysis and decision-making processes.
Introducing: ETF breakdowns
We are excited to announce the launch of ETF Breakdowns in Fey, extending our commitment to providing meticulously designed tools that empower you to make more informed investment decisions. Just like our popular Stocks canvas, the new ETF canvas has been crafted with precision and usability in mind.
Key Features Include:
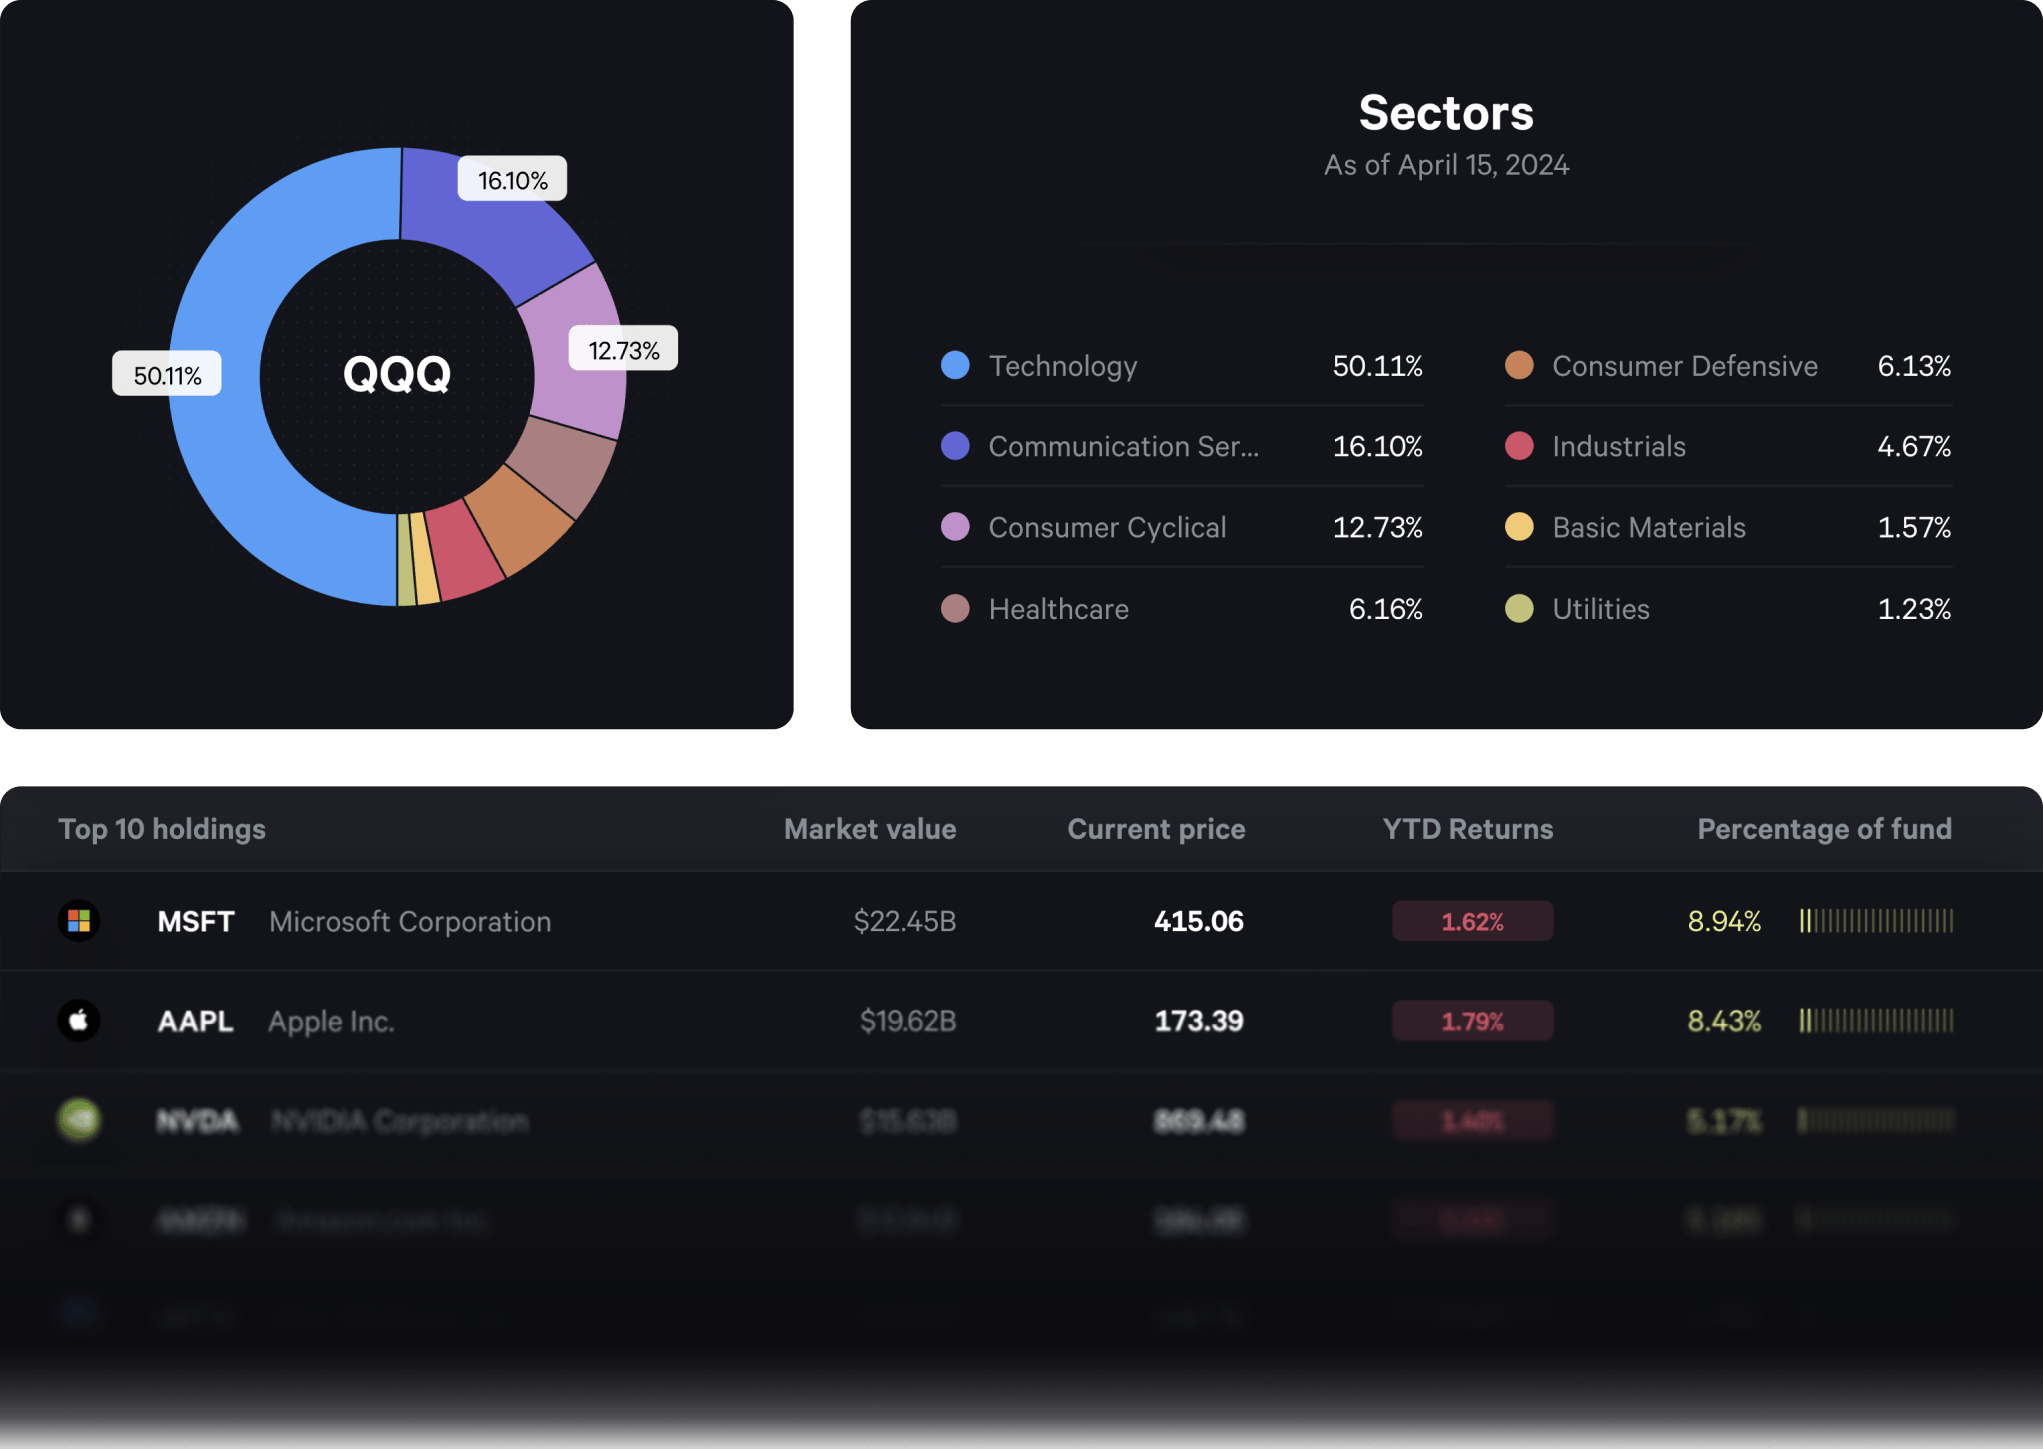
- Statistics and KPIs: Explore essential metrics such as AUM, holdings count, and inception date, along with performance indicators like 30-Day yield, dividend yield, and expense ratio. Delve into market trends with 52-week high/low data, assess valuation through PE ratio, and gauge trade volumes for comprehensive ETF analysis.
- Holdings summary: Dive deep into the assets under management within the ETF. Our comprehensive breakdown helps you see what’s inside at a glance.
- Trailing returns with benchmark: Visualize performance over time against relevant benchmarks. This feature allows you to assess how the ETF stacks up in the broader market context.
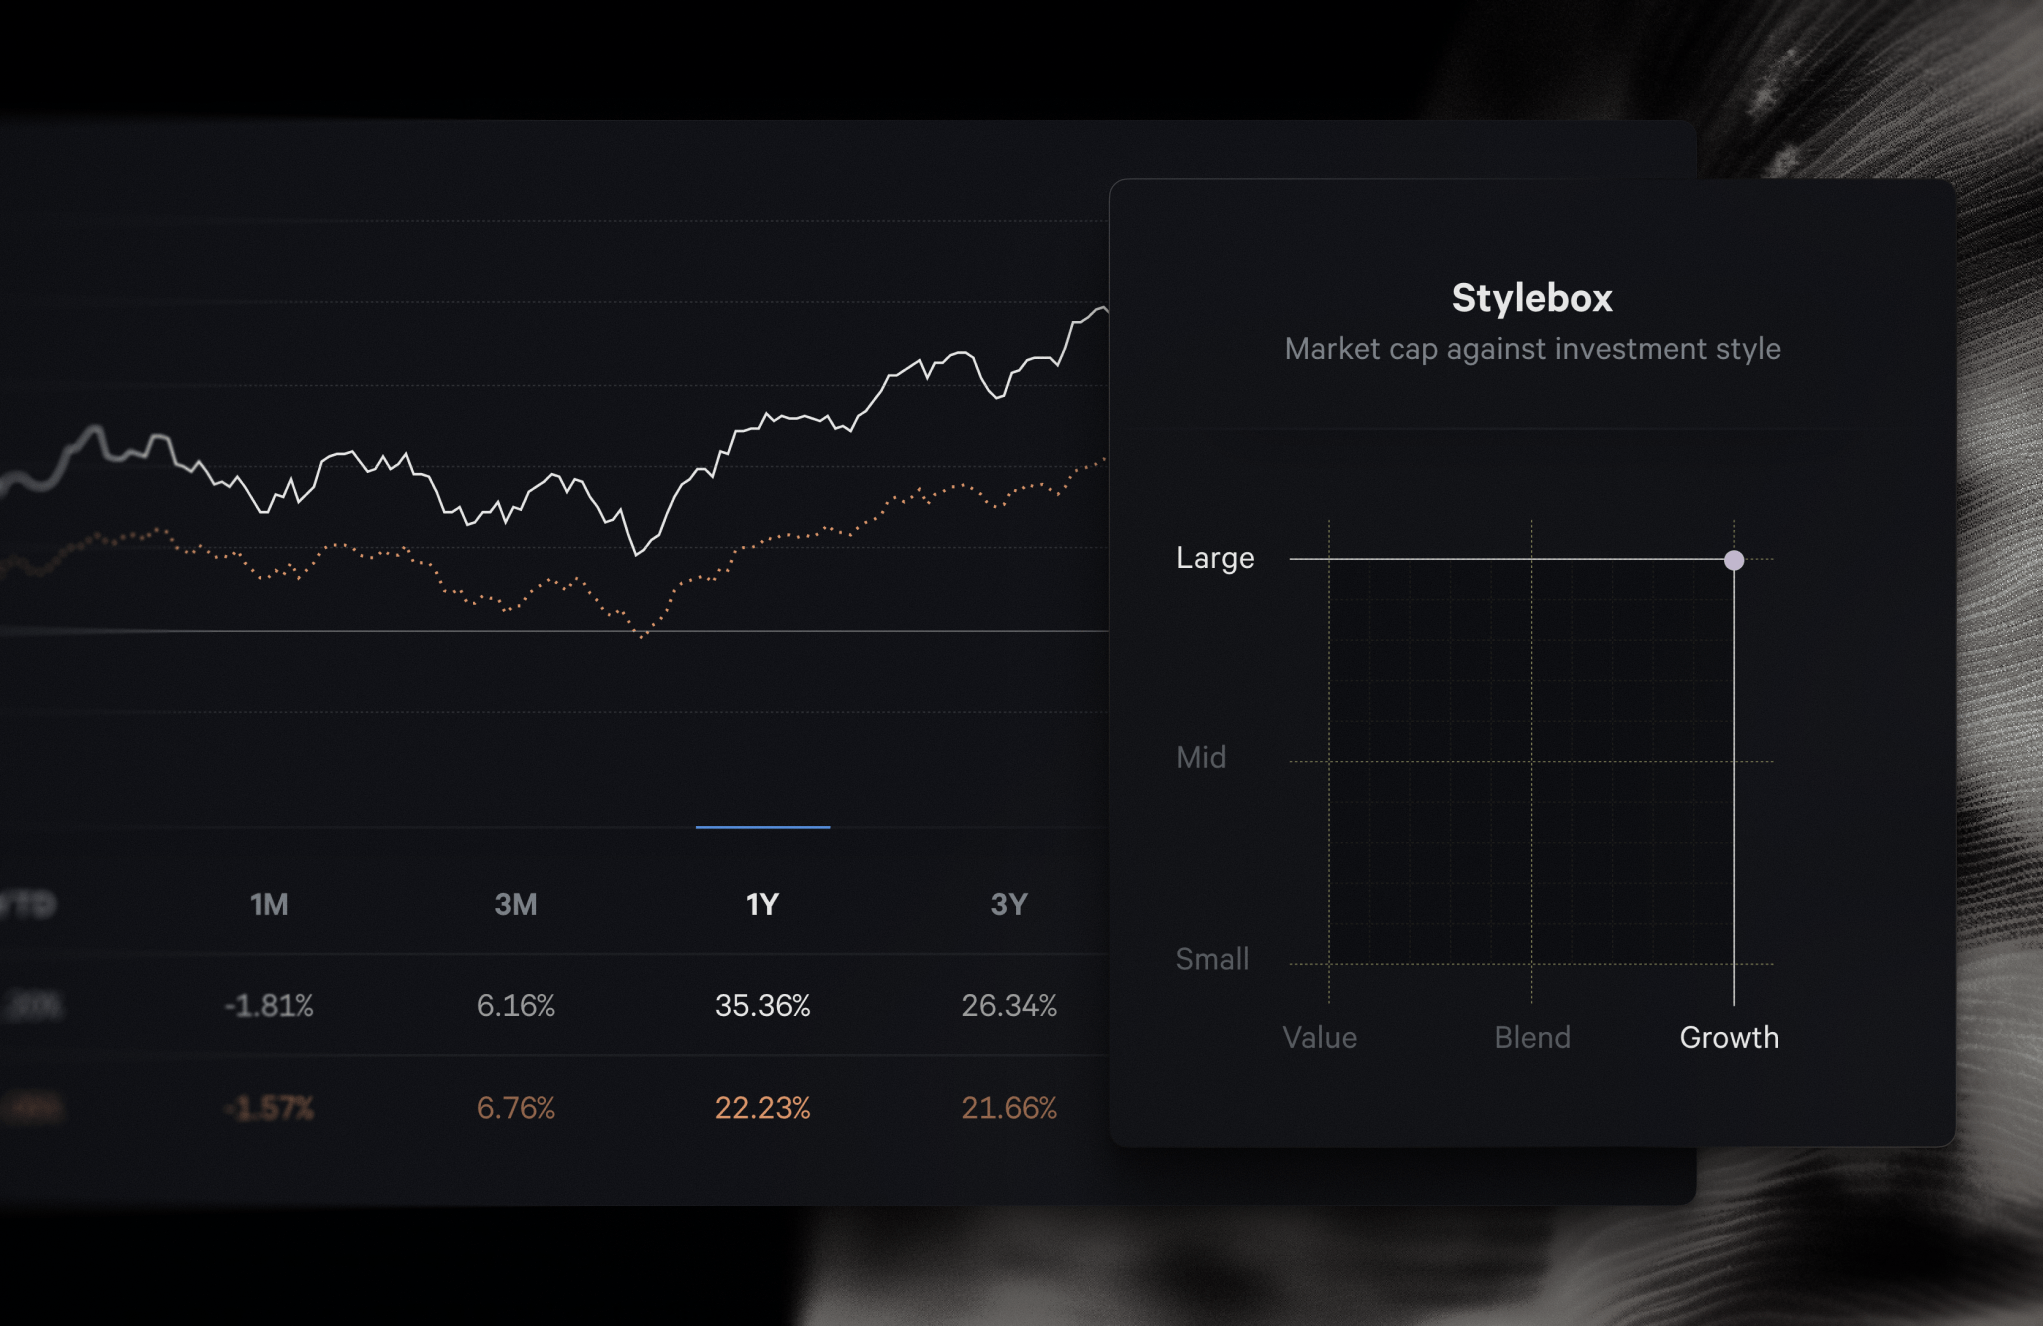
- Fund characteristics: Assess asset distribution with our “Stylebox” showing market cap against investment style. Key fund characteristics are detailed alongside benchmarks, providing a snapshot of stock counts, cap medians, ratios, dividend yields, and net assets.
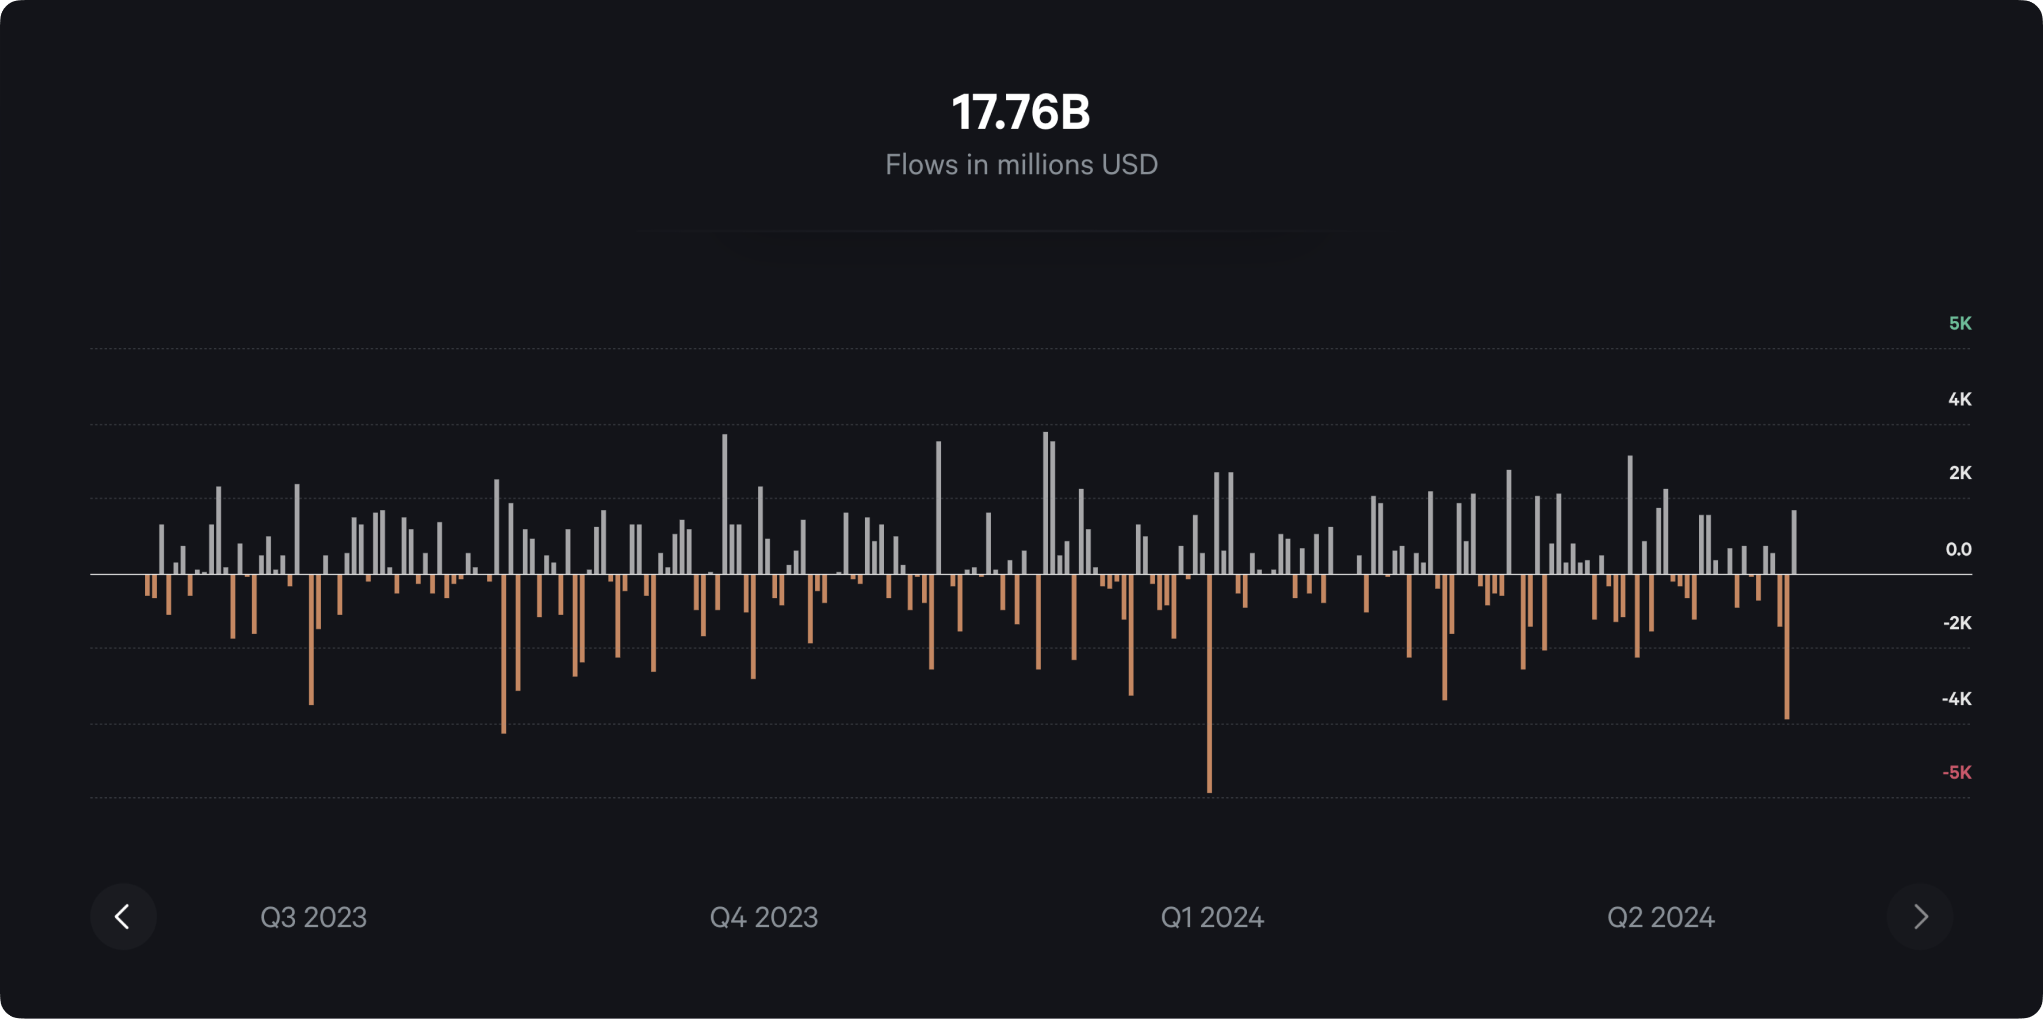
- Daily net flows chart: Track investment flows in and out of the ETF with our daily updated charts. This insight is vital for understanding market trends and investor behavior.
- Dividend breakdown: Explore the dividend distribution of the ETF. We provide detailed information on dividend yields and payout frequencies to help you evaluate potential returns.
We strongly believe in transparency and detailed analytics to support your investment decisions. The new ETF Canvas is just another step towards enhancing your ability to navigate the financial markets with confidence and insight.
We've Redesigned Our Target Chart for Improved Readability.
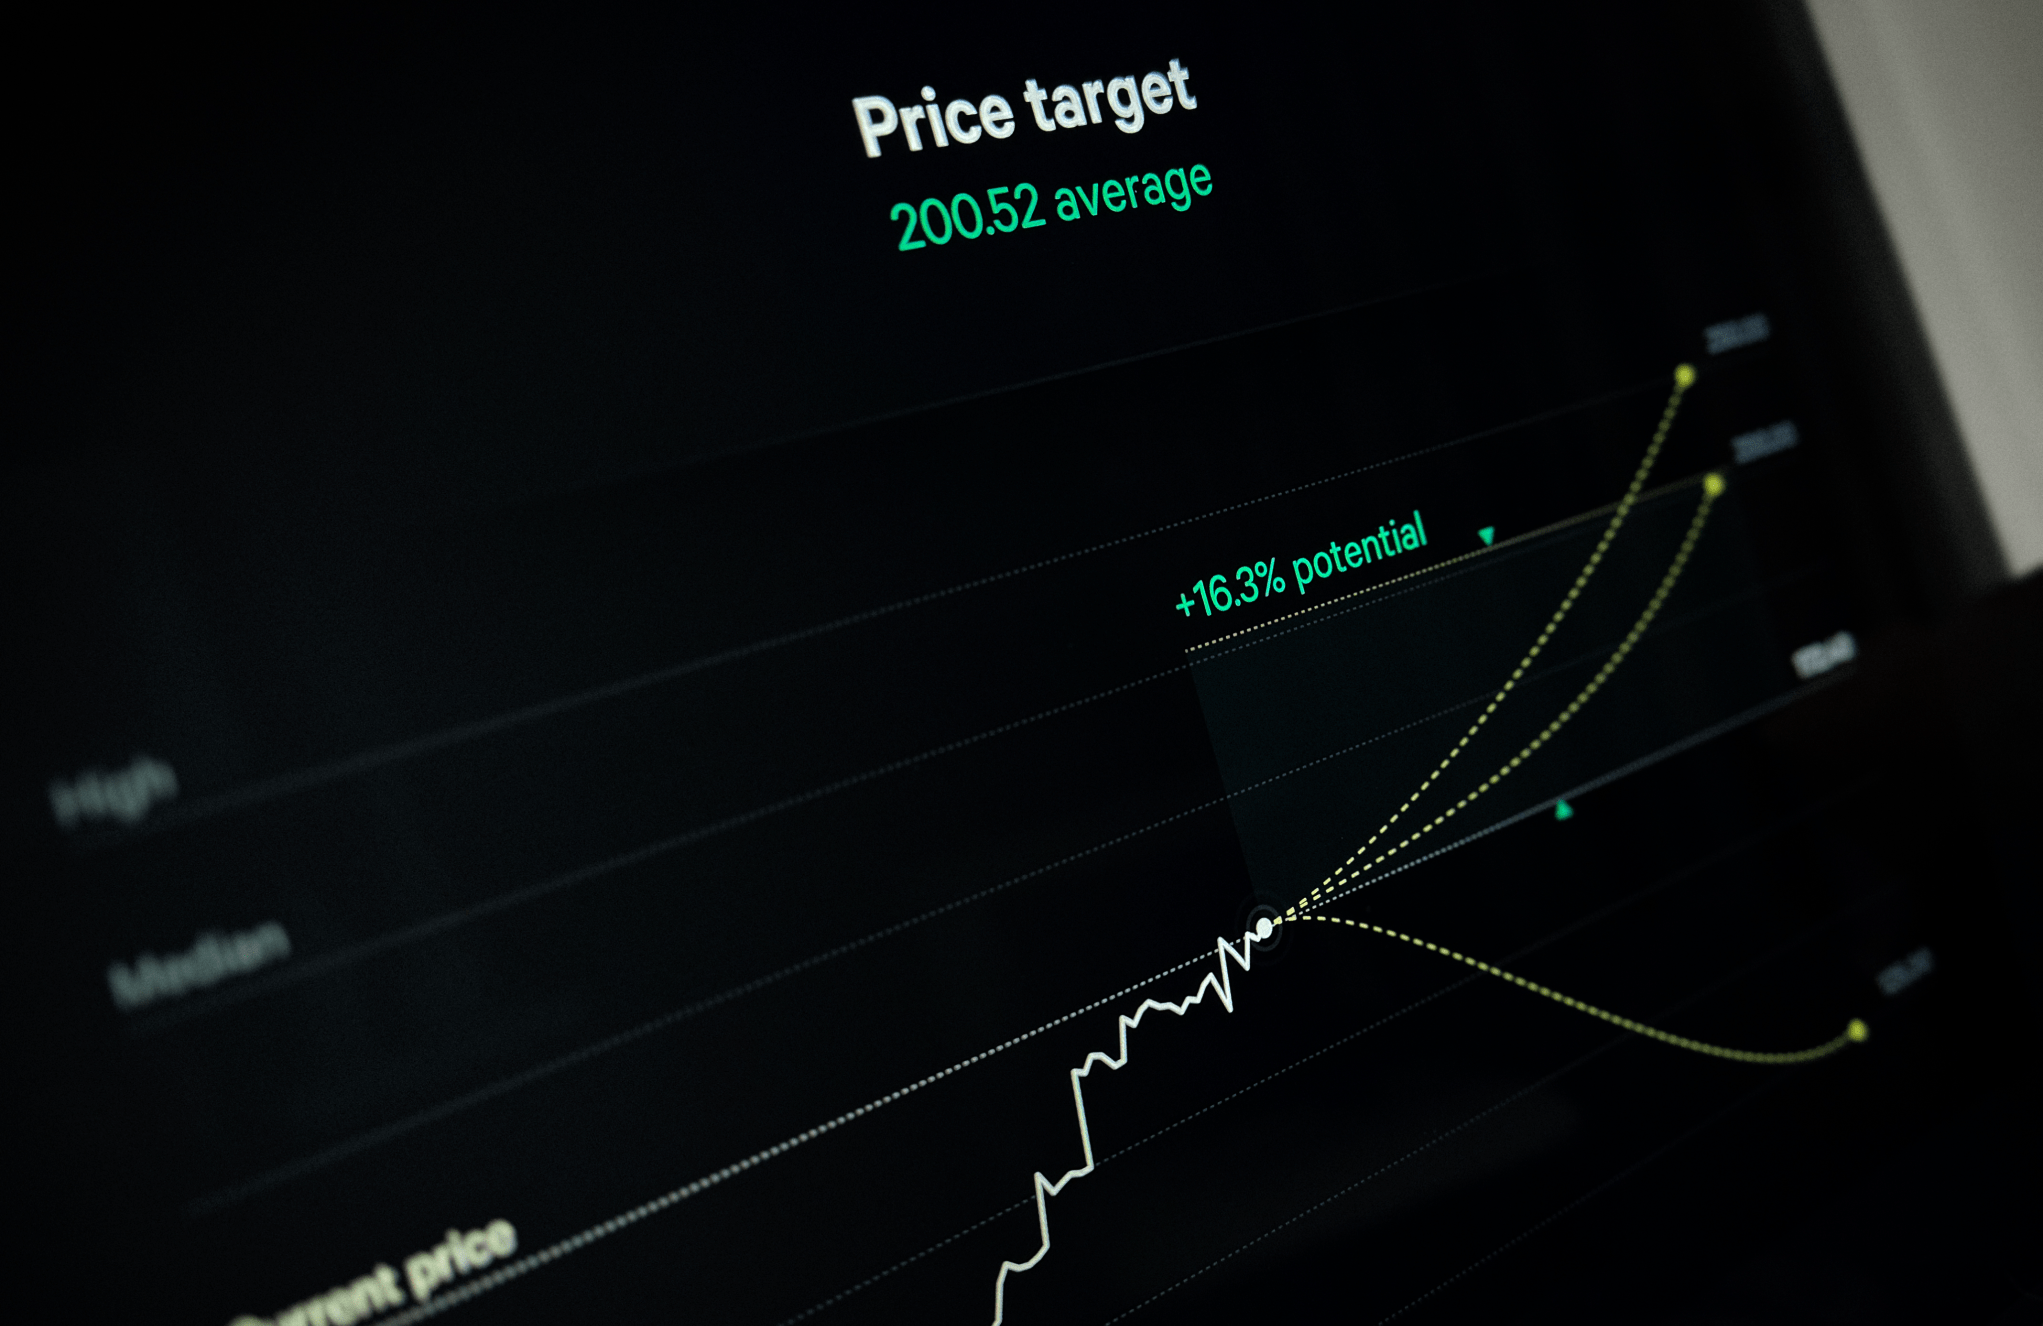
We’ve reimagined our Target chart, streamlining the design to enhance your experience.
What changed
- Unified view: No more tab-hopping! We've consolidated what used to be split across two tabs into a single, comprehensive view. Now, you can absorb all the information you need at one glance.
- Potential at a peek: To aid in your decision-making, we've introduced a visual indicator of potential percentage movement directly in the chart to give you a sense of the future.
- Aesthetic upgrade: We firmly believe that form is just as important as function. The new design is not just user-friendly – it’s beautiful. We’ve crafted a sleek interface that’s both beautiful and intuitive.
We hope these tools enhance your market research and help you make more informed decisions.
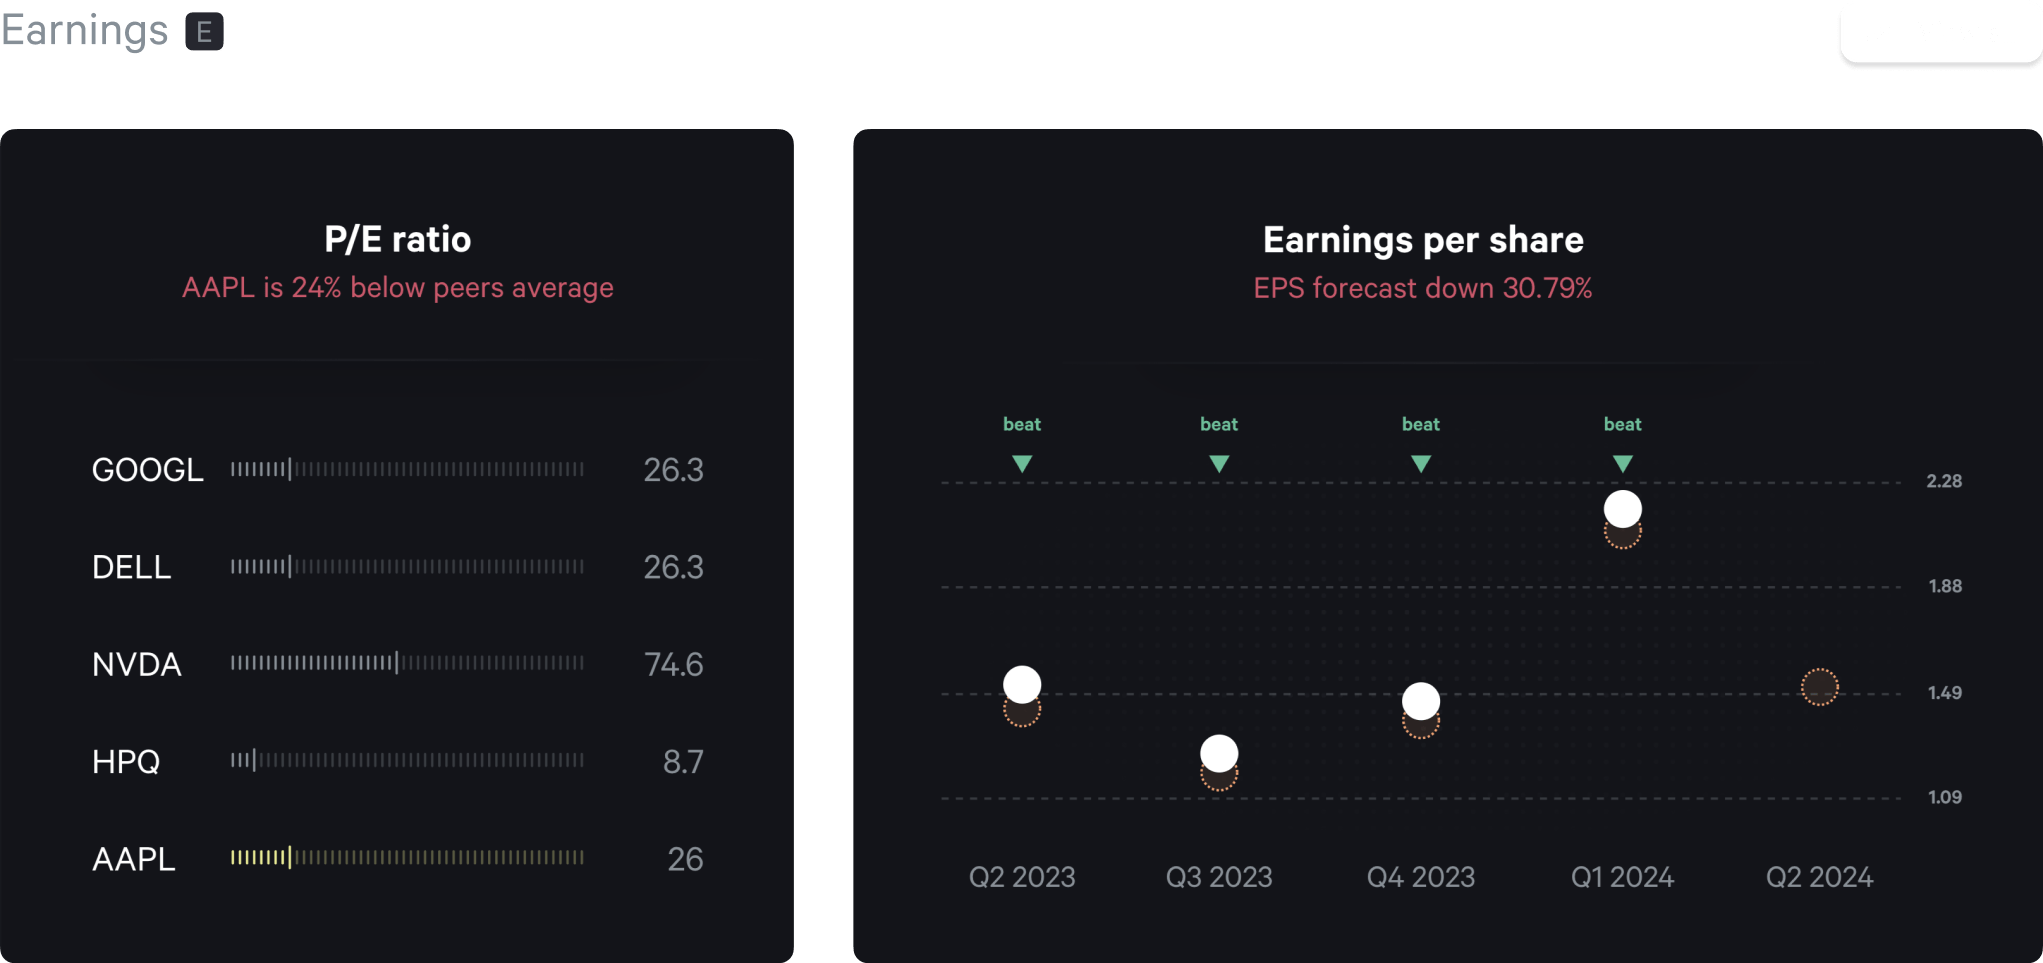
Enhanced earnings insights.
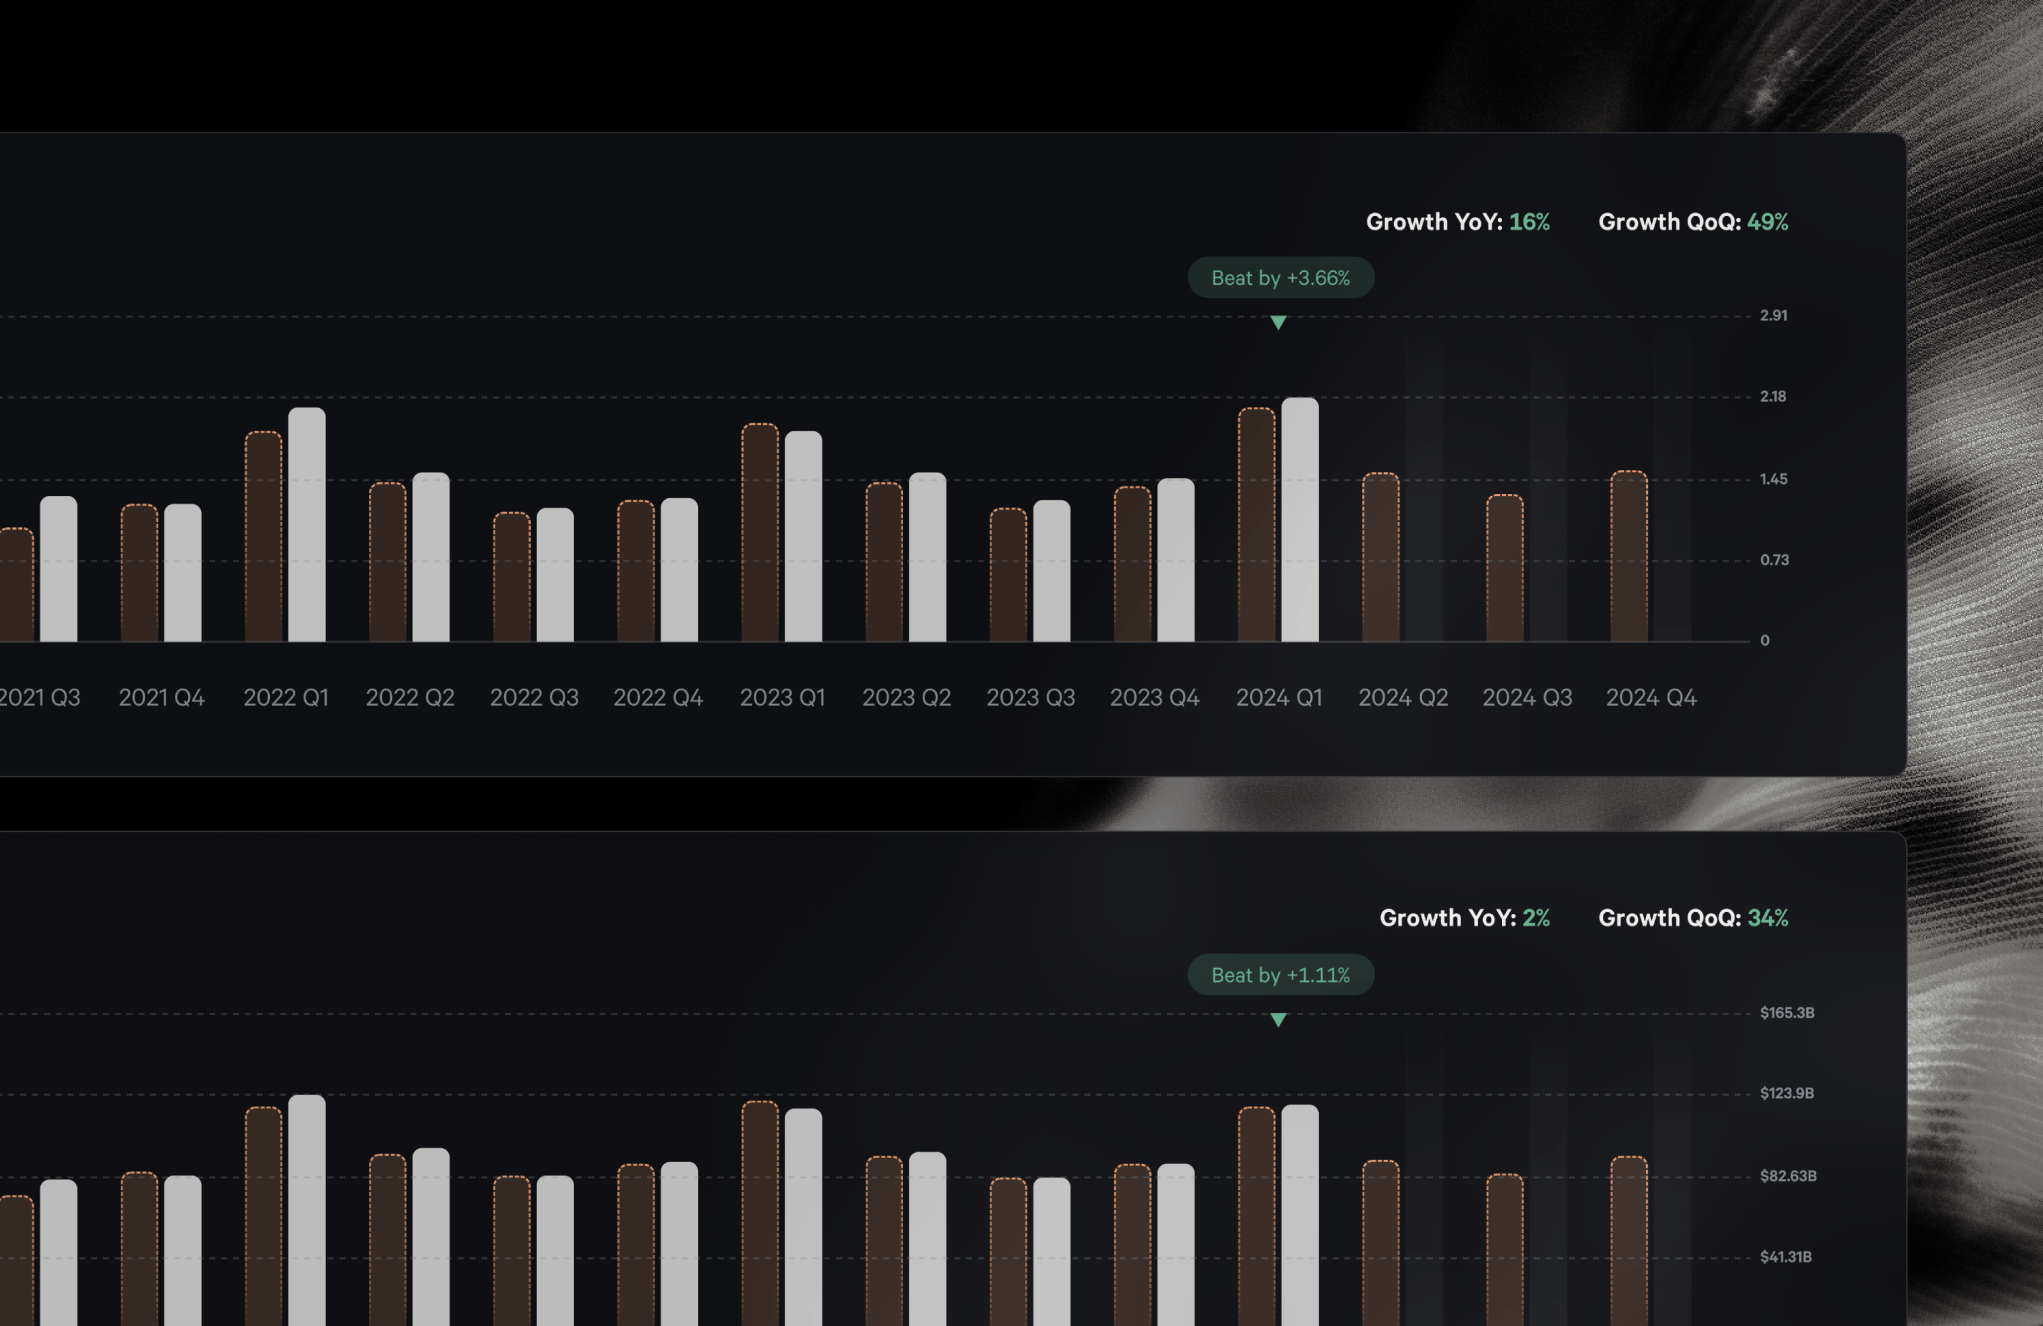
We’ve recently made several updates to our Earnings feature to provide a more detailed and visually compelling analysis experience.
What changed
- Earnings history data sheet: Dive deep into a company's performance with our new data sheet, which offers a chronological record of earnings outcomes, estimated vs. actual EPS, and revenue figures.
- EPS and revenue graphs: Visualize a company's financial health over time with our new graphs that display historical earnings per share and revenue data. These graphs are designed to help you identify trends at a glance.
- Updated visuals: We've refreshed the look with a new color scheme and a cleaner presentation of the EPS figures on our stock canvases to make the data easier to read and the interface more user-friendly.
Our markets page has been revamped.
We've made a few key updates to our Markets page to provide you with a clearer, more comprehensive view of the markets.
What changed
- Top indices with volatility insights: We’ve added a new section showcasing Top Indices YTD performance, including a volatility label to give you a quick sense of the market’s behavior.
- 2Y vs 10Y Spread chart: Gain insight into the economic forecast with the 2-Year vs 10-Year Spread chart. This is a useful gauge of what the bond market is signalling about the future.
- Volatility Index (VIX): The VIX is now directly available to you, so you can better assess market volatility as it happens.
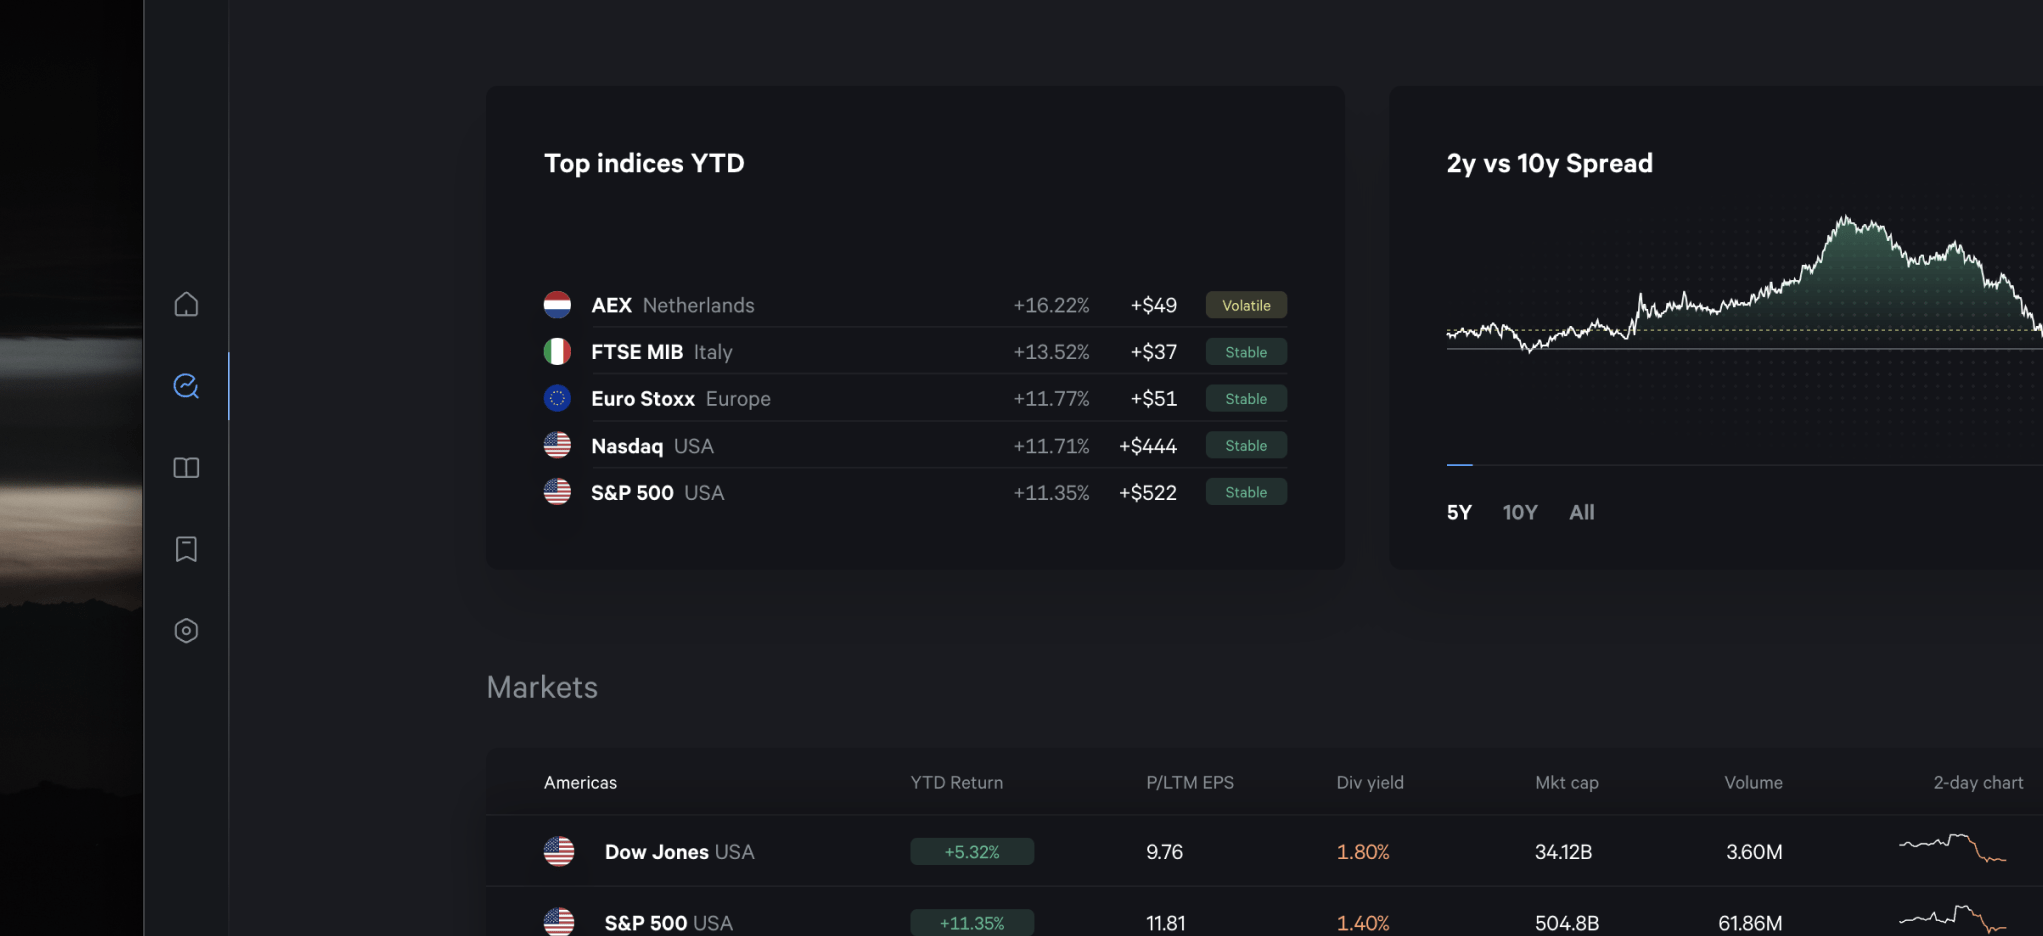
We hope these tools enhance your market research and help you make more informed decisions.
Introducing: Economic Calendar.
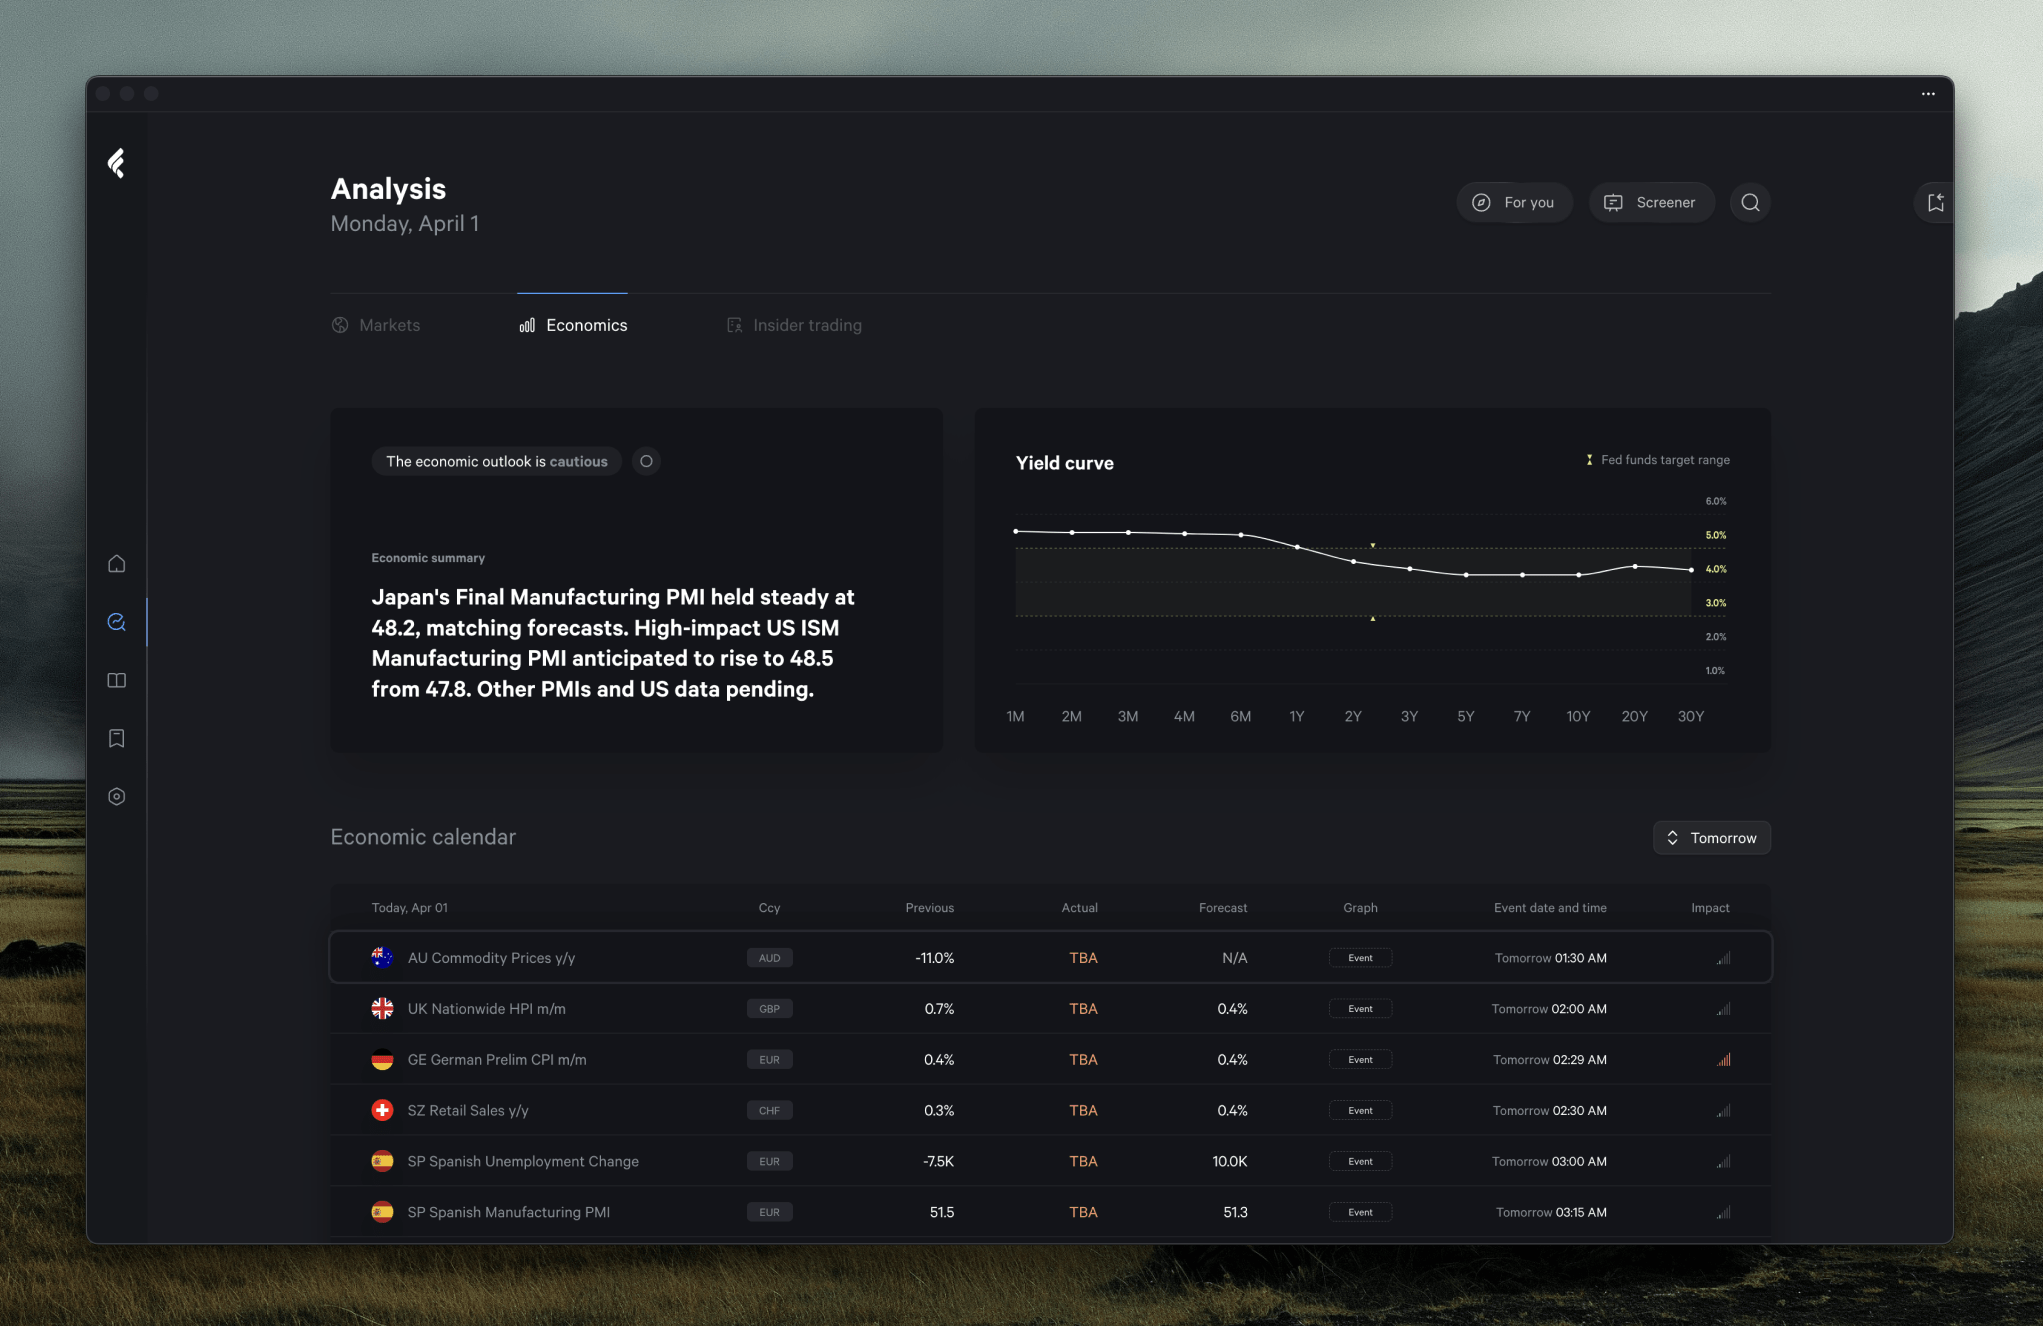
In our continuous effort to empower our customers with the most intuitive and predictive tools for market analysis, we are proud to unveil our latest feature: the Economic Calendar.
Fey now presents a comprehensive overview of the economic landscape. We synthesize complex data to forecast market movements, providing you with an edge in your investment strategies.
This update also introduces a yield curve graph, a crucial financial indicator. By illustrating the interest rates across different maturities, it serves as a gauge for investor sentiment and economic expectations.
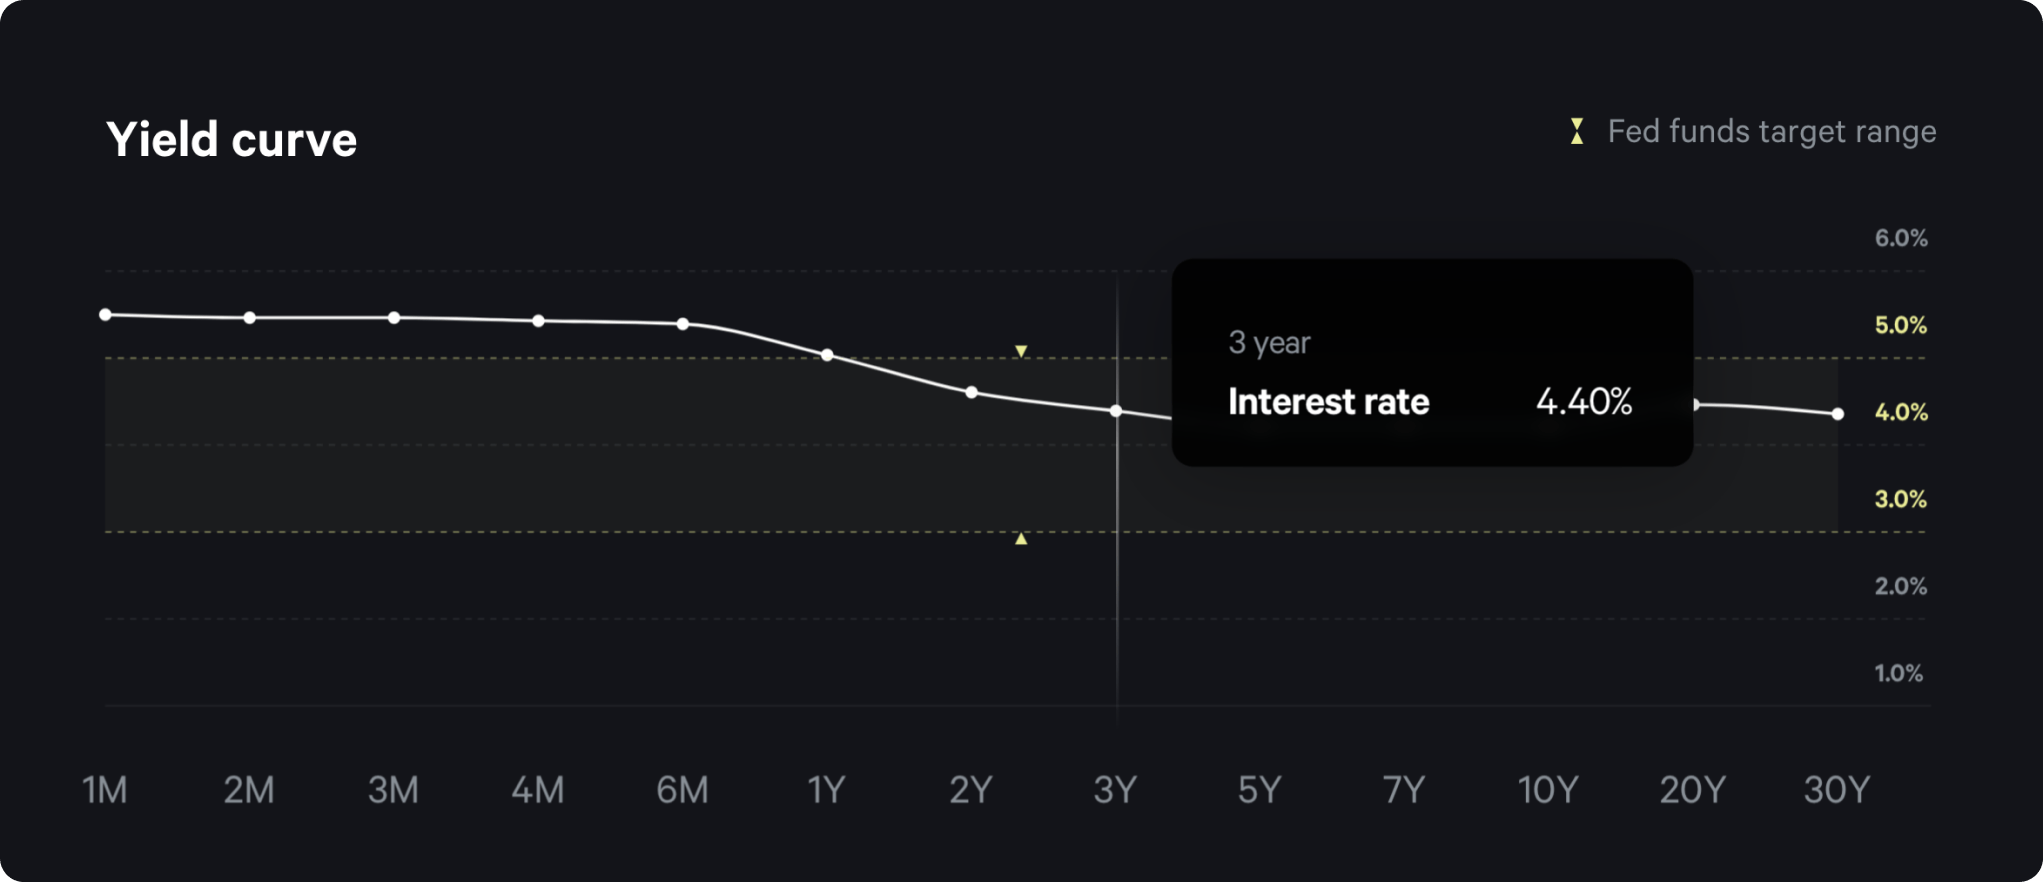
Key features of the Economic Calendar include:
- AI-Synthesized Overview: Get a distilled, AI-driven snapshot of global economic indicators.
- Yield Curve Insight: Visualize the bond market's pulse with our integrated yield curve chart.
- Comprehensive Timeline: Effortlessly scroll through past, present, and future economic events, complete with projections and outcomes.
Your decision-making is about to become more informed, your strategies more refined, and your market presence stronger.
Our Insight cards have a new look and feel.
What changed?
Updated Insight tab: The Insight card now pulses with the beat of live updates. With the integration of OpenAI, we're delivering real-time news headlines so you're always in the know. Plus, enjoy the new sleek animation that brings the "what's happening" section to life.
Updated about tab: Understanding a company has never been easier. Our updated About tab offers concise summaries, key industry information, employee headcount, and foundation dates, alongside direct links to company websites for deep dives.
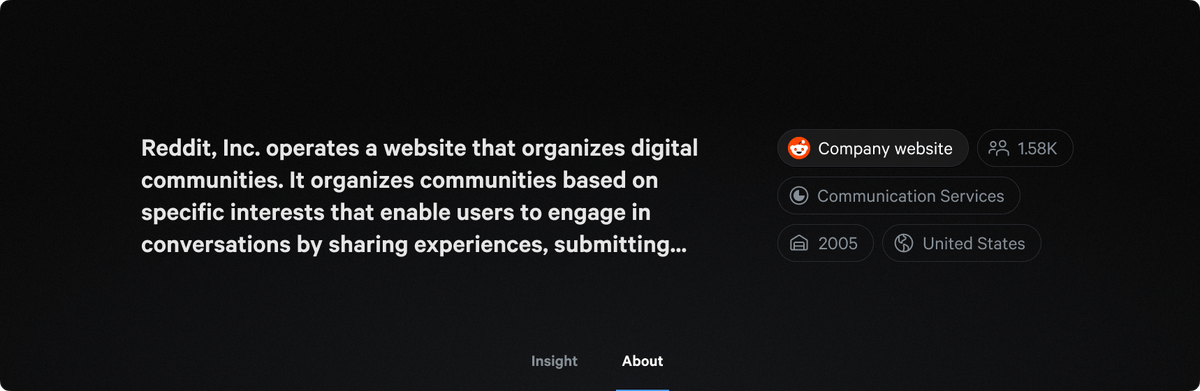
This update may be modest in size but it’s big on impact—offering you the up-to-the-minute insights and company information you need to stay well-informed.
Introducing Fey version 1.5.

The latest update of Fey, version 1.5, now available to all our customers. This version brings a suite of enhancements across the platform.
News revamp
The news experience within Fey has been completely transformed. Utilizing AI, we're able to deliver article summaries instantaneously, ensuring our customers receive the latest information as it unfolds. Our global news page now presents top-tier articles and a summary of today's headlines. We’ve also improved the browsing experience by adding ticker logos to each headline. These headlines are consolidated from multiple sources, reducing redundancy and enabling you to access a unified summary with a single click while retaining the option to explore original articles.
Feed enhancement
The “For You” page has undergone significant improvements for reliability and clarity. Updates are now delivered more often and more consistently, and we’ve balanced the word count to ensure each piece is as informative as it is easy to digest.
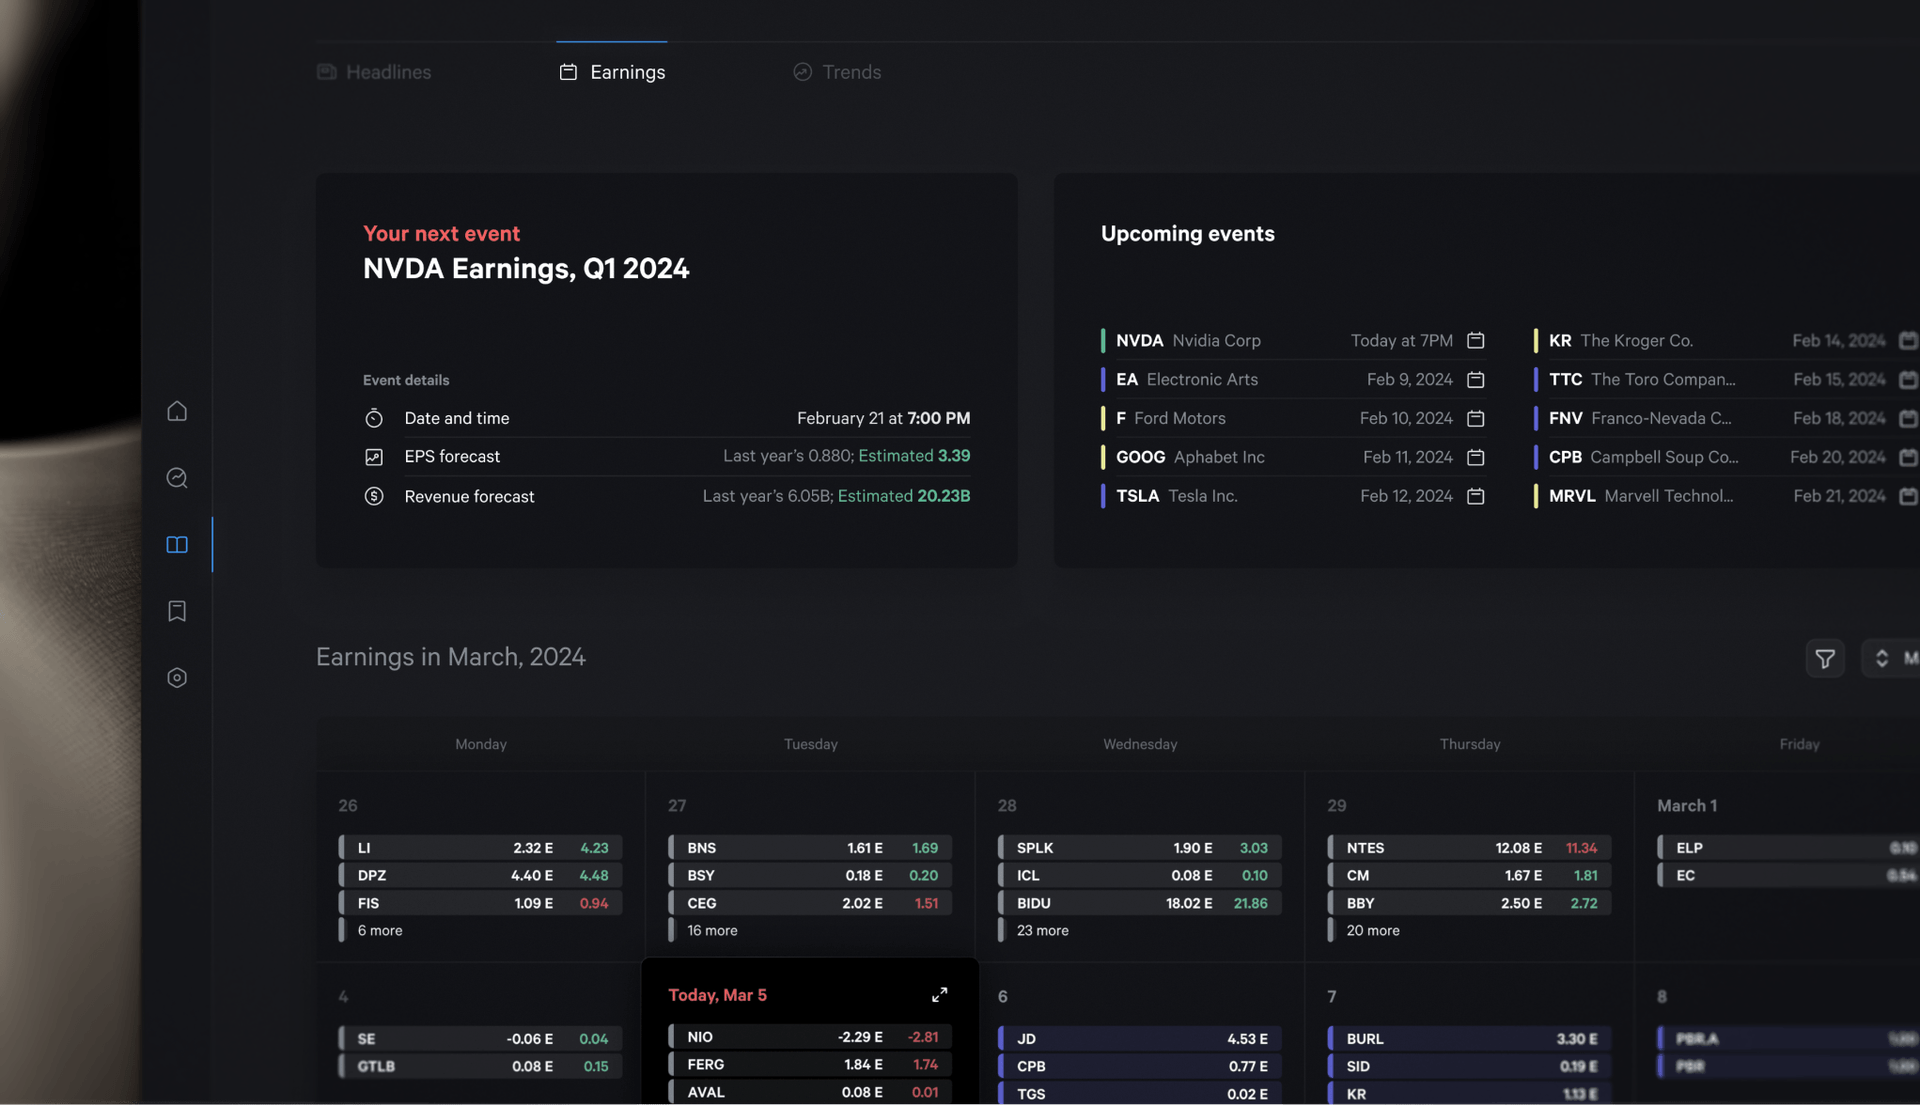
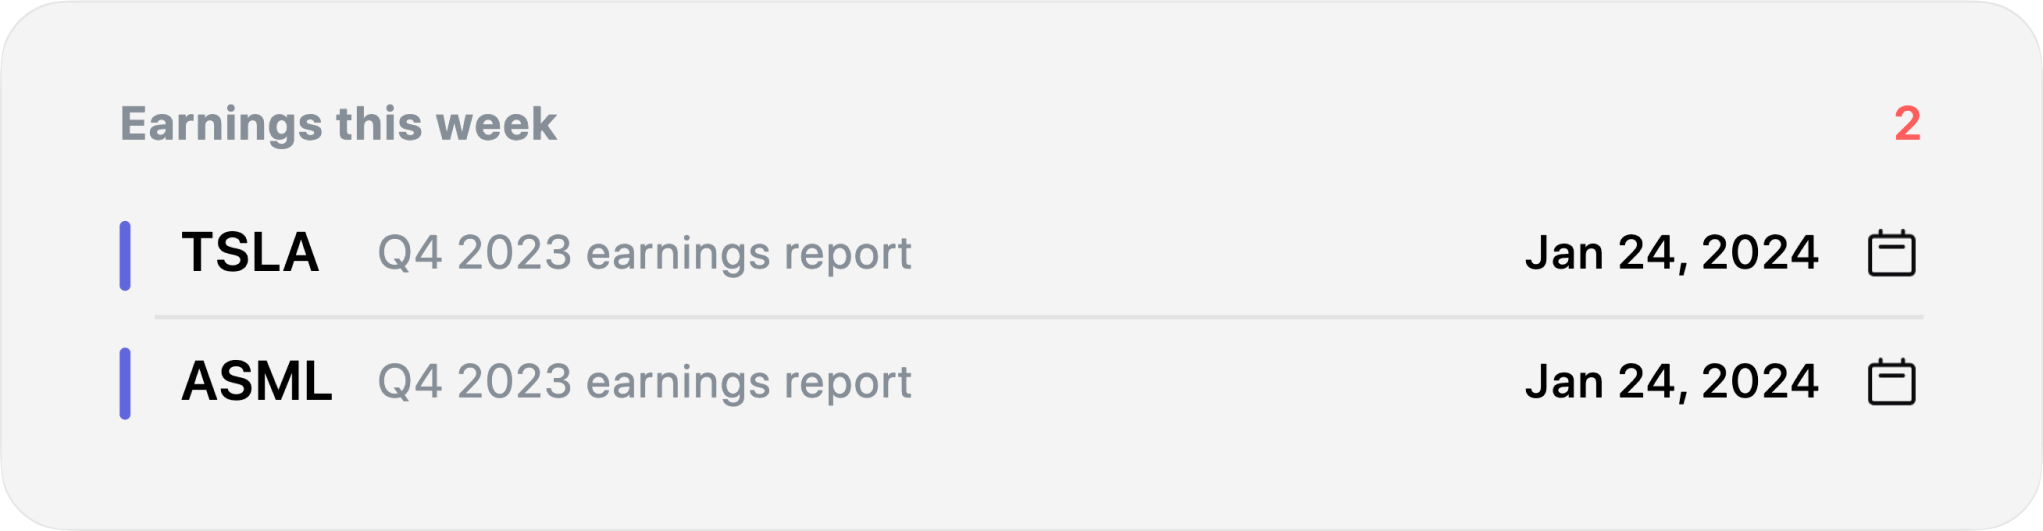
Earnings calendar expansion
Our earnings calendar has been expanded to provide a comprehensive view of past and upcoming earnings reports. Presented in a clear monthly grid, this allows our customers to easily navigate and strategize around earnings releases.
Sector performance refinement
We’ve refined the sector performance card for better readability, making it straightforward for users to quickly understand market trends at a glance.
Visual enhancements with company logos
We have added hundreds of high-quality company logos to further refine your browsing experience on Fey. Alongside this visual upgrade, we've also redesigned our fallback image for tickers that do not have logos, ensuring a sleek and consistent appearance throughout the platform. Free access to our logos available here.
Backend overhaul
We have re-engineered our backend architecture to be more robust, efficient, and significantly faster. This overhaul provides our team with greater product control without the complexity of managing Kubernetes, workloads, and other cloud-native technologies.

This update reflects our commitment to delivering a product that not only meets but exceeds the expectations of our users. Explore Fey 1.5 and experience the enhancements firsthand.
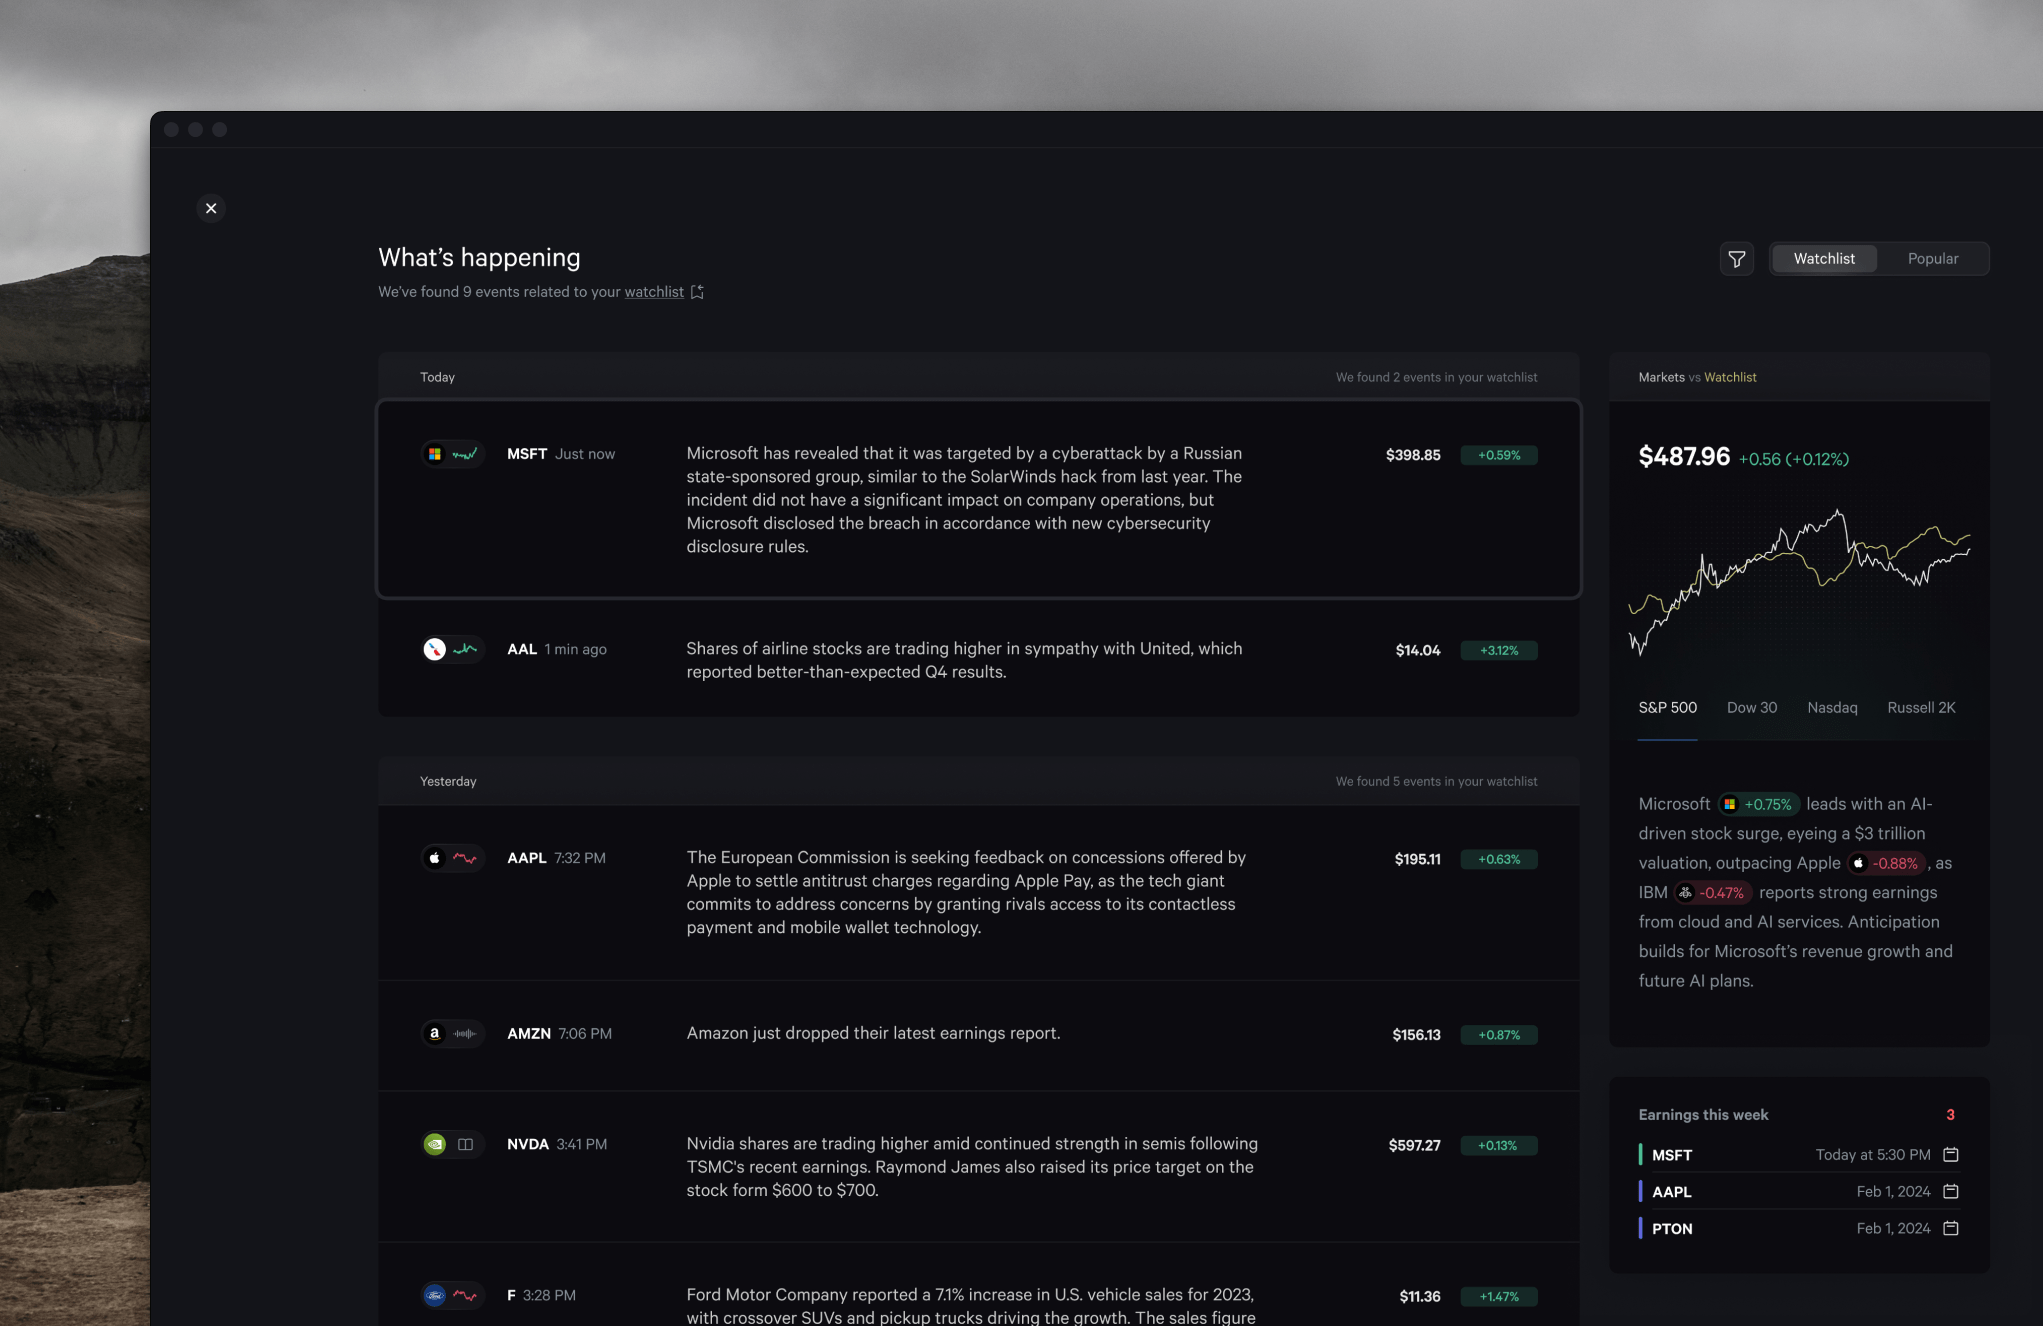
We've significantly improved our Market Sentiment card.
We've dialed up our Market Sentiment card to keep you in the loop more effectively than ever. Here's what you'll find on Fey's homepage with your upgraded "What's happening today" card:
What's new?
- Frequent updates: Your market insight now refreshes 5 times per day, with morning, mid-morning, noon, afternoon, and evening updates.
- Refined sentiment indicator: We're slicing through the market noise with an even more accurate sentiment gauge, displaying neutral, bullish, or bearish sentiments based on the latest news and index prices.
- Enhanced accuracy: Our algorithms have been fine-tuned to give you the sharpest read on market moods, so you're in the know more confidently.
Introducing "For you" — your personalized news feed, updated 24/7.
In our latest update, we're excited to bring you "For You," a new feature designed to streamline your market research on Fey. This personalized feed not only brings you tailored market news and events but also integrates insights from your watchlist, comparing them with broader market trends to optimize your research.
What's inside?
- Targeted market news: Get news and updates that are in line with your investment interests.
- Curated events: Stay informed about events and earnings that can affect your portfolio.
- Efficient research: Save time with a streamlined and relevant flow of information.
- Continuous updates: Receive real-time updates 24/7 to keep you informed.
- Watchlist tracking: "For You" tracks your watchlist, providing insights tailored to you.
- Market comparisons: Gain perspective on how your watchlist performs against overall market trends.
Accessing your feed is a breeze. Simply click "For You" at the top right of the page headers, or just press `Y` anytime to dive in.
This update is part of our commitment to making Fey more intuitive and effective for your financial journey.
Our Weekly Newsletter is now available for all Fey customers.
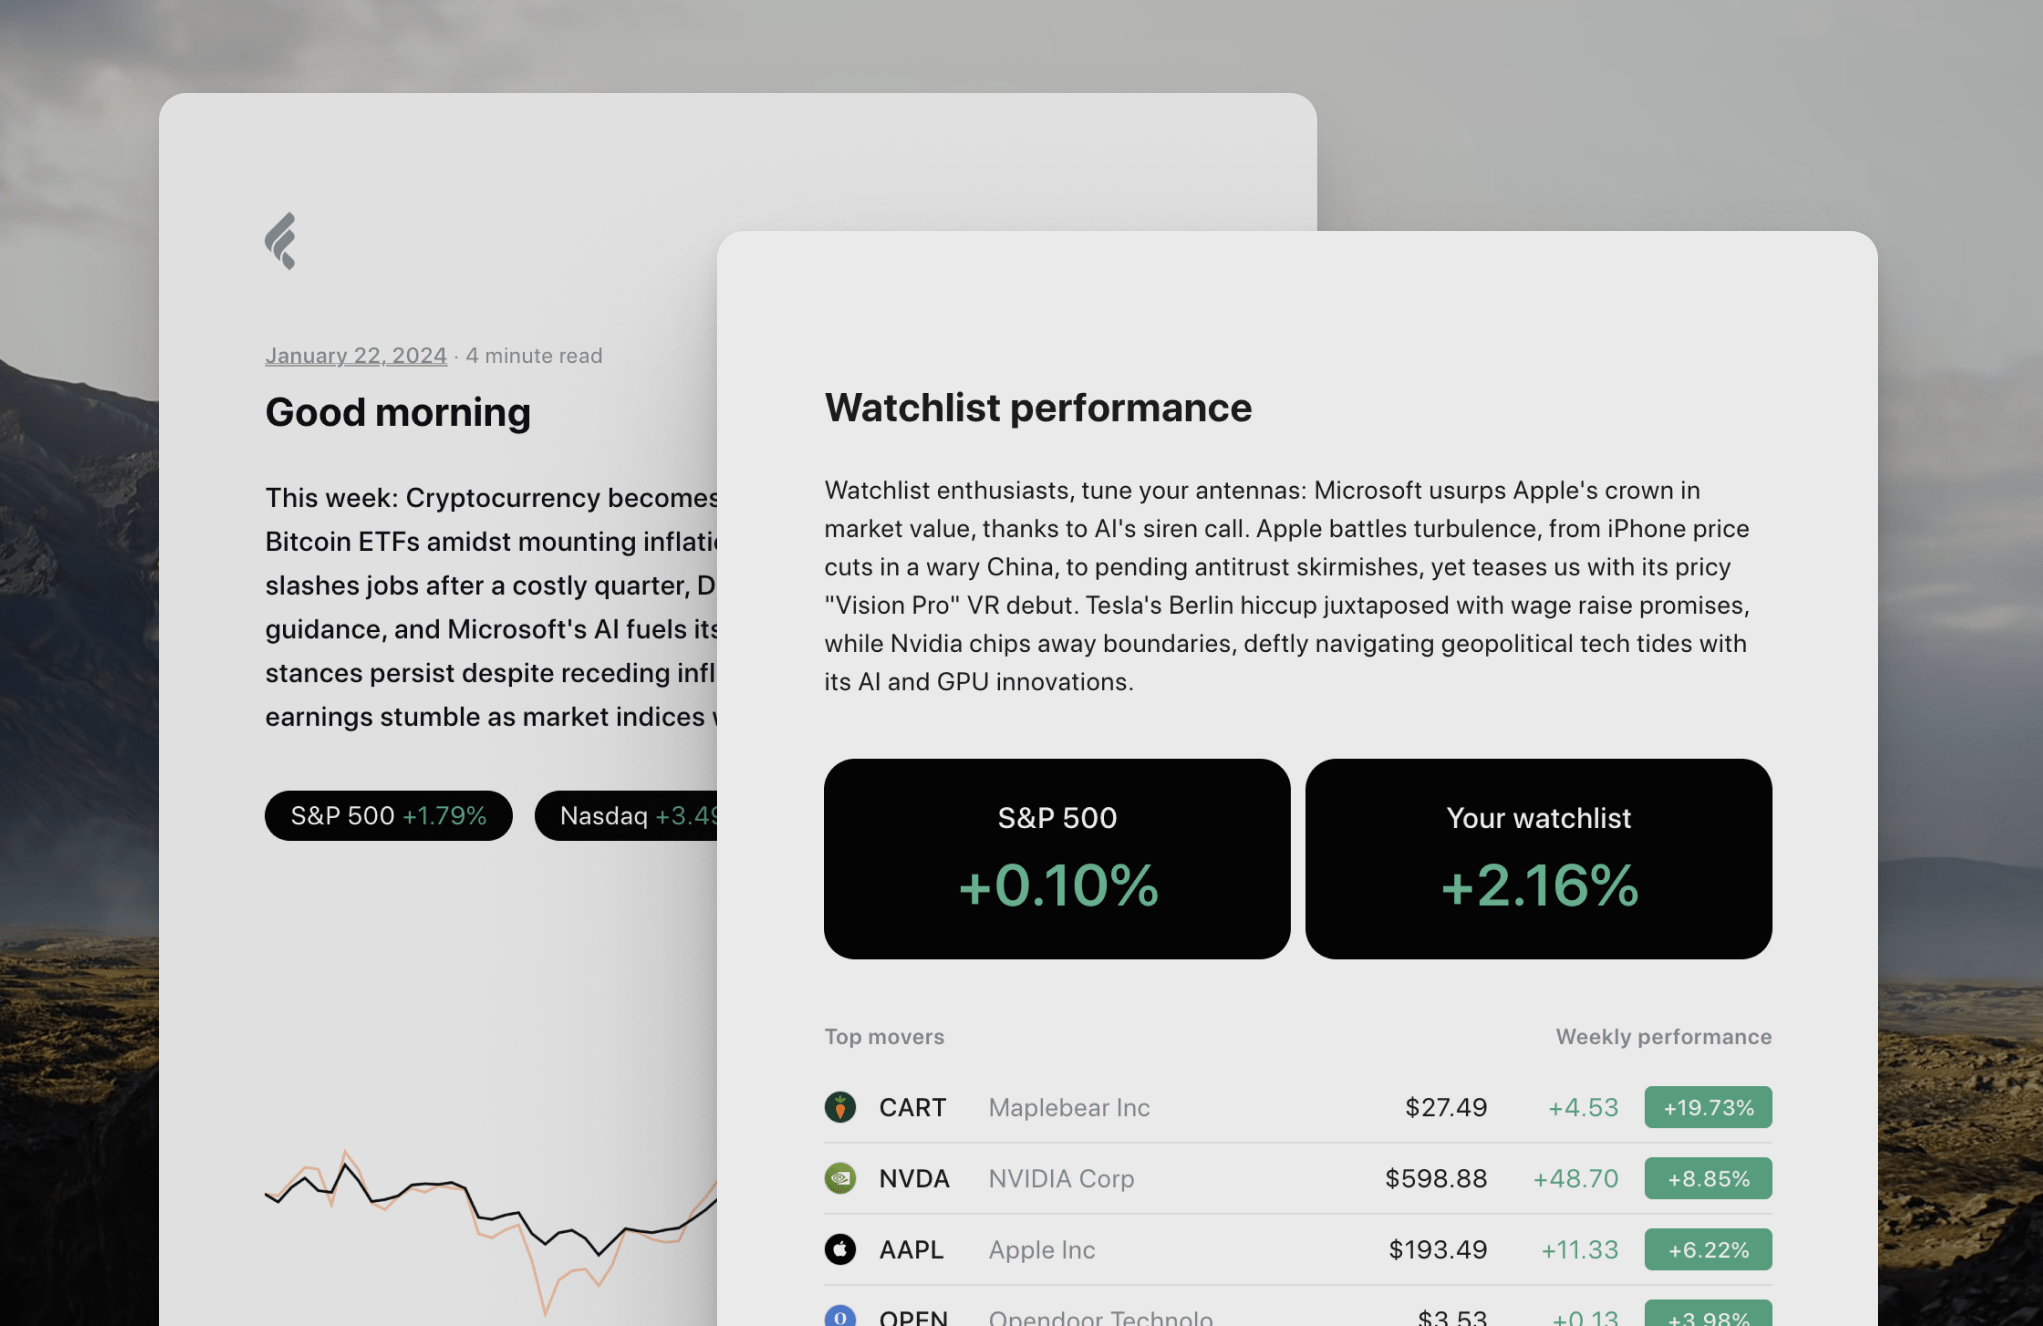
Starting this week, our newsletter will be delivered to every Fey customer's inbox every Monday morning. It's designed to provide a straightforward, efficient overview of your financial interests.
What's inside?
- AI-driven analysis of your watchlist: leveraging advanced AI, we delve deep into your watchlist, offering insights and trends to kickstart your week.
- Summary of market news: stay ahead of the curve with a concise summary of the latest market news, ensuring you never miss a beat.
- Personalized news based on your watchlist: your investments are unique, and so should be your news. Get tailored updates directly related to the stocks you're watching.
- Weekly watchlist performance review: track how your watchlist performed over the past week with our insightful analysis, helping you make informed decisions.
- Upcoming earnings alerts: be the first to know about upcoming earnings reports for the companies on your watchlist.
At the heart of our newsletter is a combination of GPT-driven content, news APIs for the latest updates, and pricing APIs for accurate market data. This blend of technology ensures that the information you receive is not only timely but also highly relevant and personalized.
Fey now lets you to share charts of your preferred timeframe with just one click.
As market enthusiasts, we understand the routine: find a ticker, take a screenshot of its chart, and share it—a process that is both time-consuming and lacks finesse. We're thrilled to roll out Fey's latest feature to address this.
Instant Chart Generation: With a single click, Fey now generates and copies a beautiful chart of your chosen timeframe to your clipboard, all in under 100ms.

How It Works
- On any company page, simply press the 'Share chart' button. Fey will instantly generate a chart and copy it to your clipboard.
- If you want to share a link or download the image, those options are readily available.
- For power users: highlight a company from any page and press ⌘ + shift + C. Fey will capture the daily chart for you in less than a second.
This update is more than just an enhancement of how you share market movements; it's designed to add a touch of delight to your day. Share with confidence, inform with style, and help everyone stay in tune with the market's pulse.
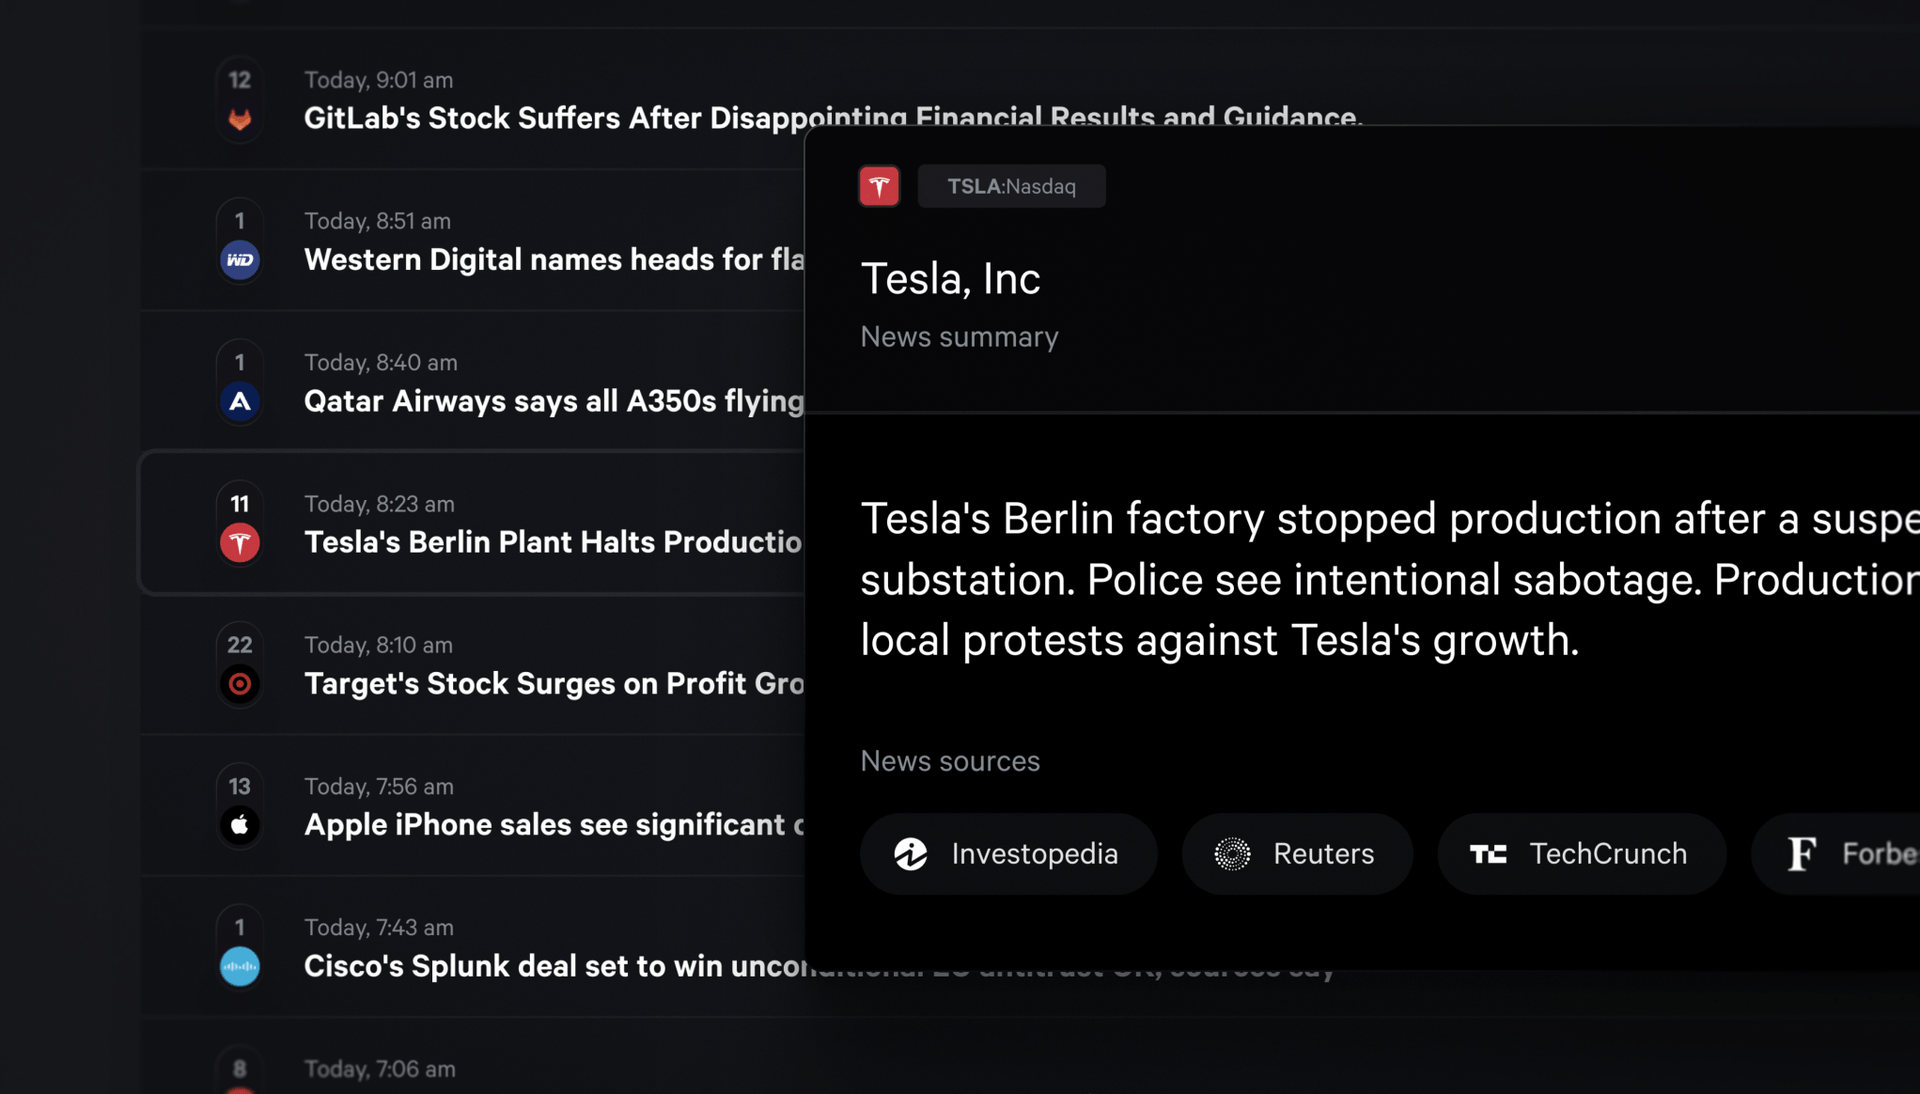
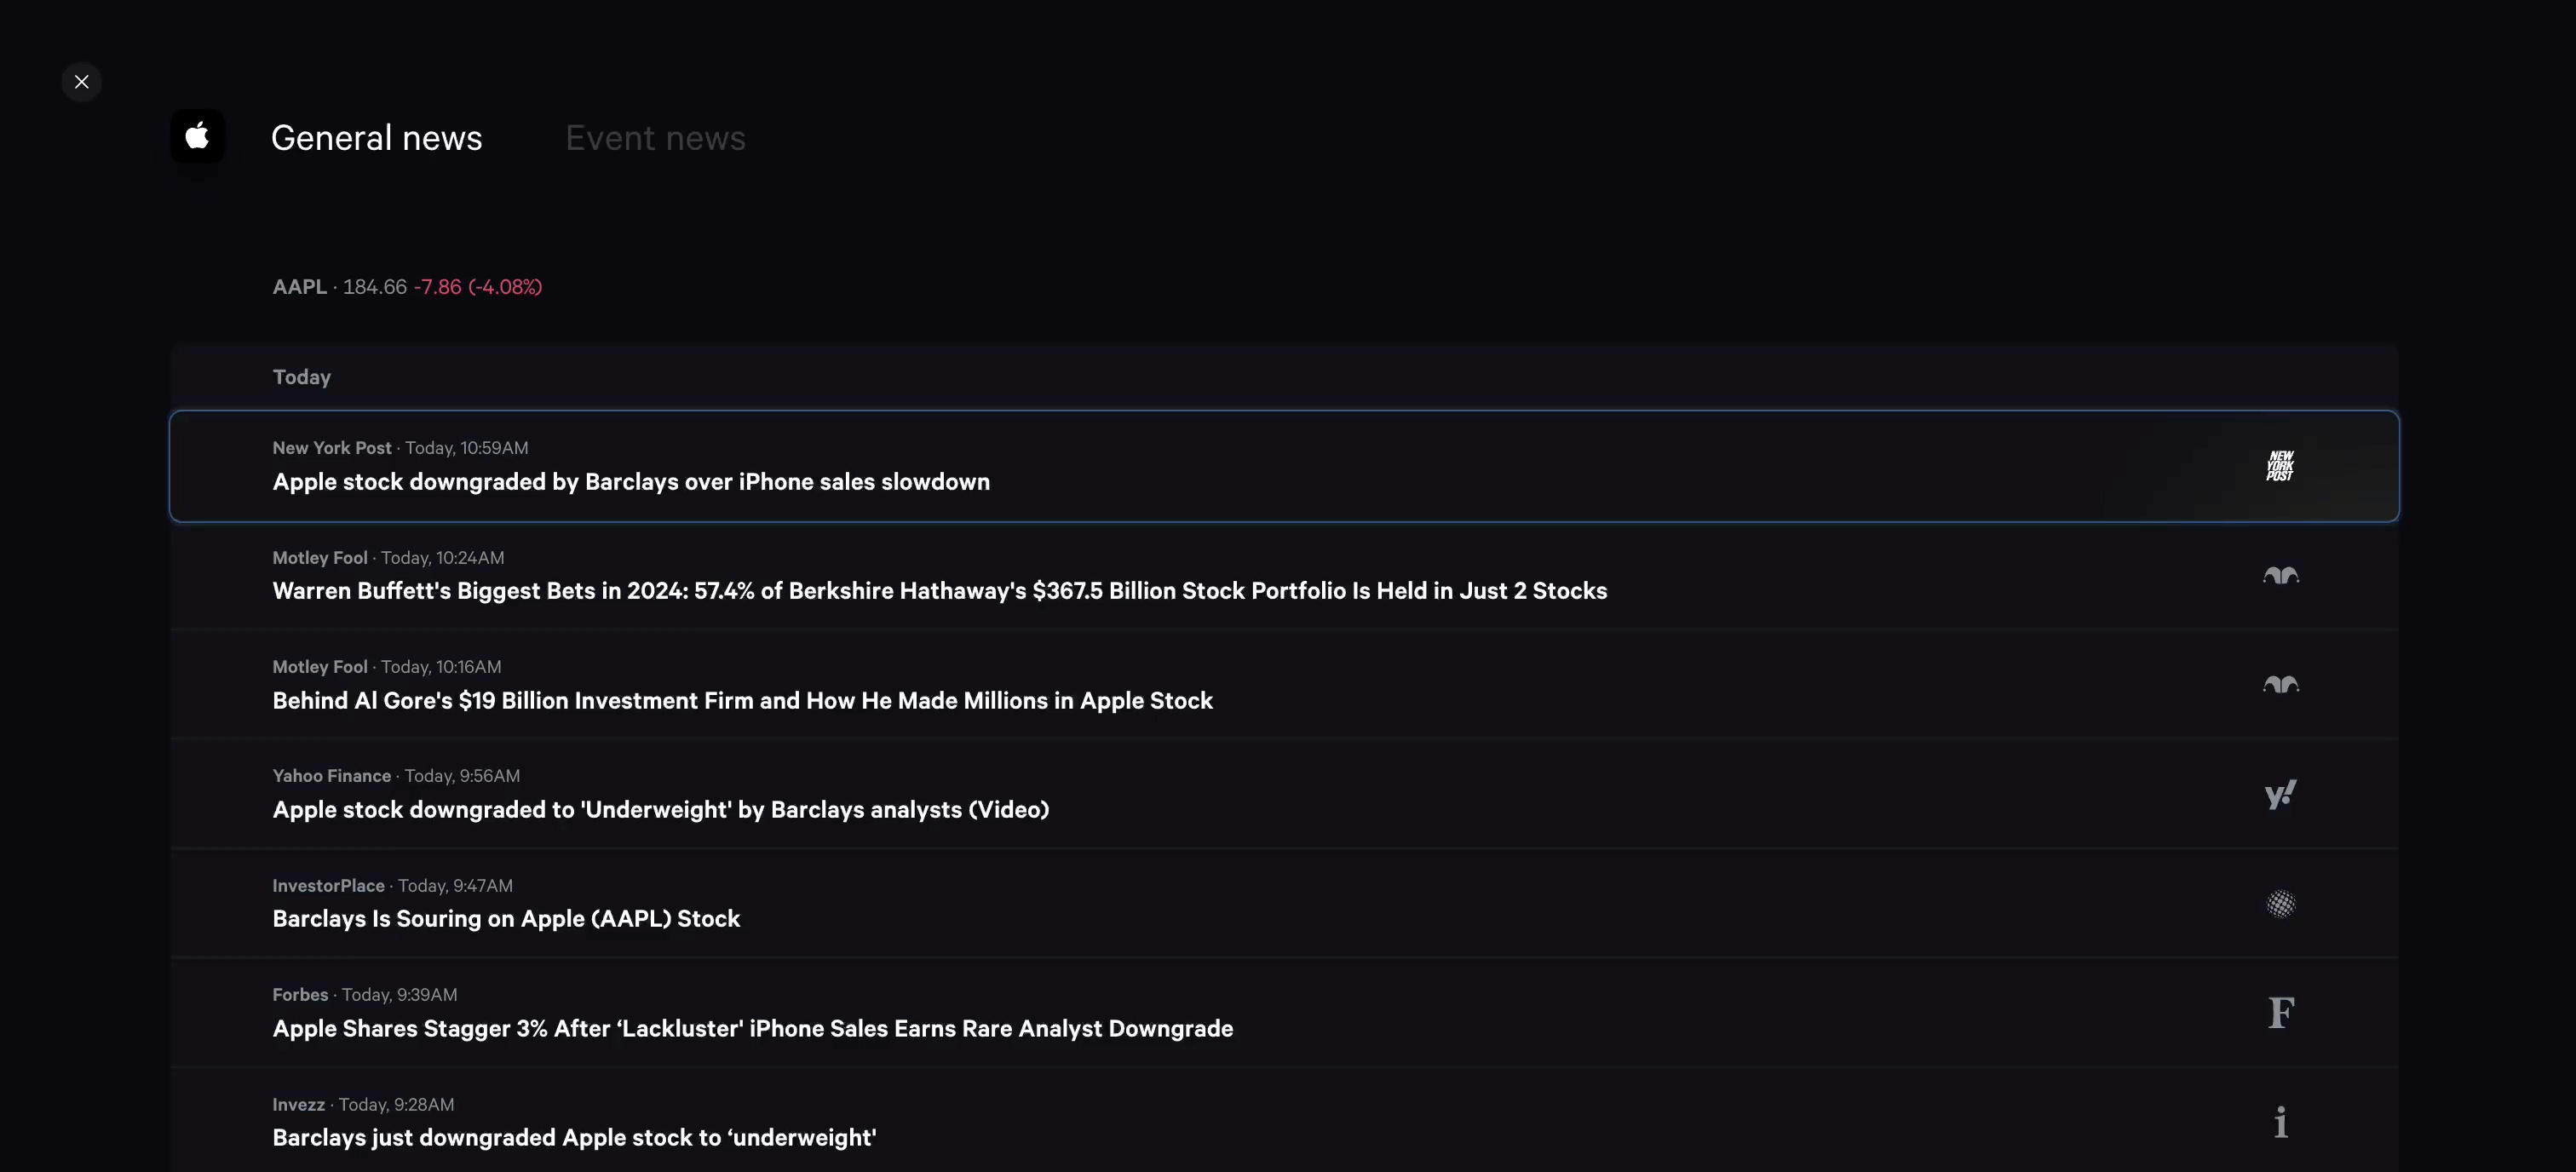
We've revamped our news page with an improved UI and the addition of "Events" for more concise insights.
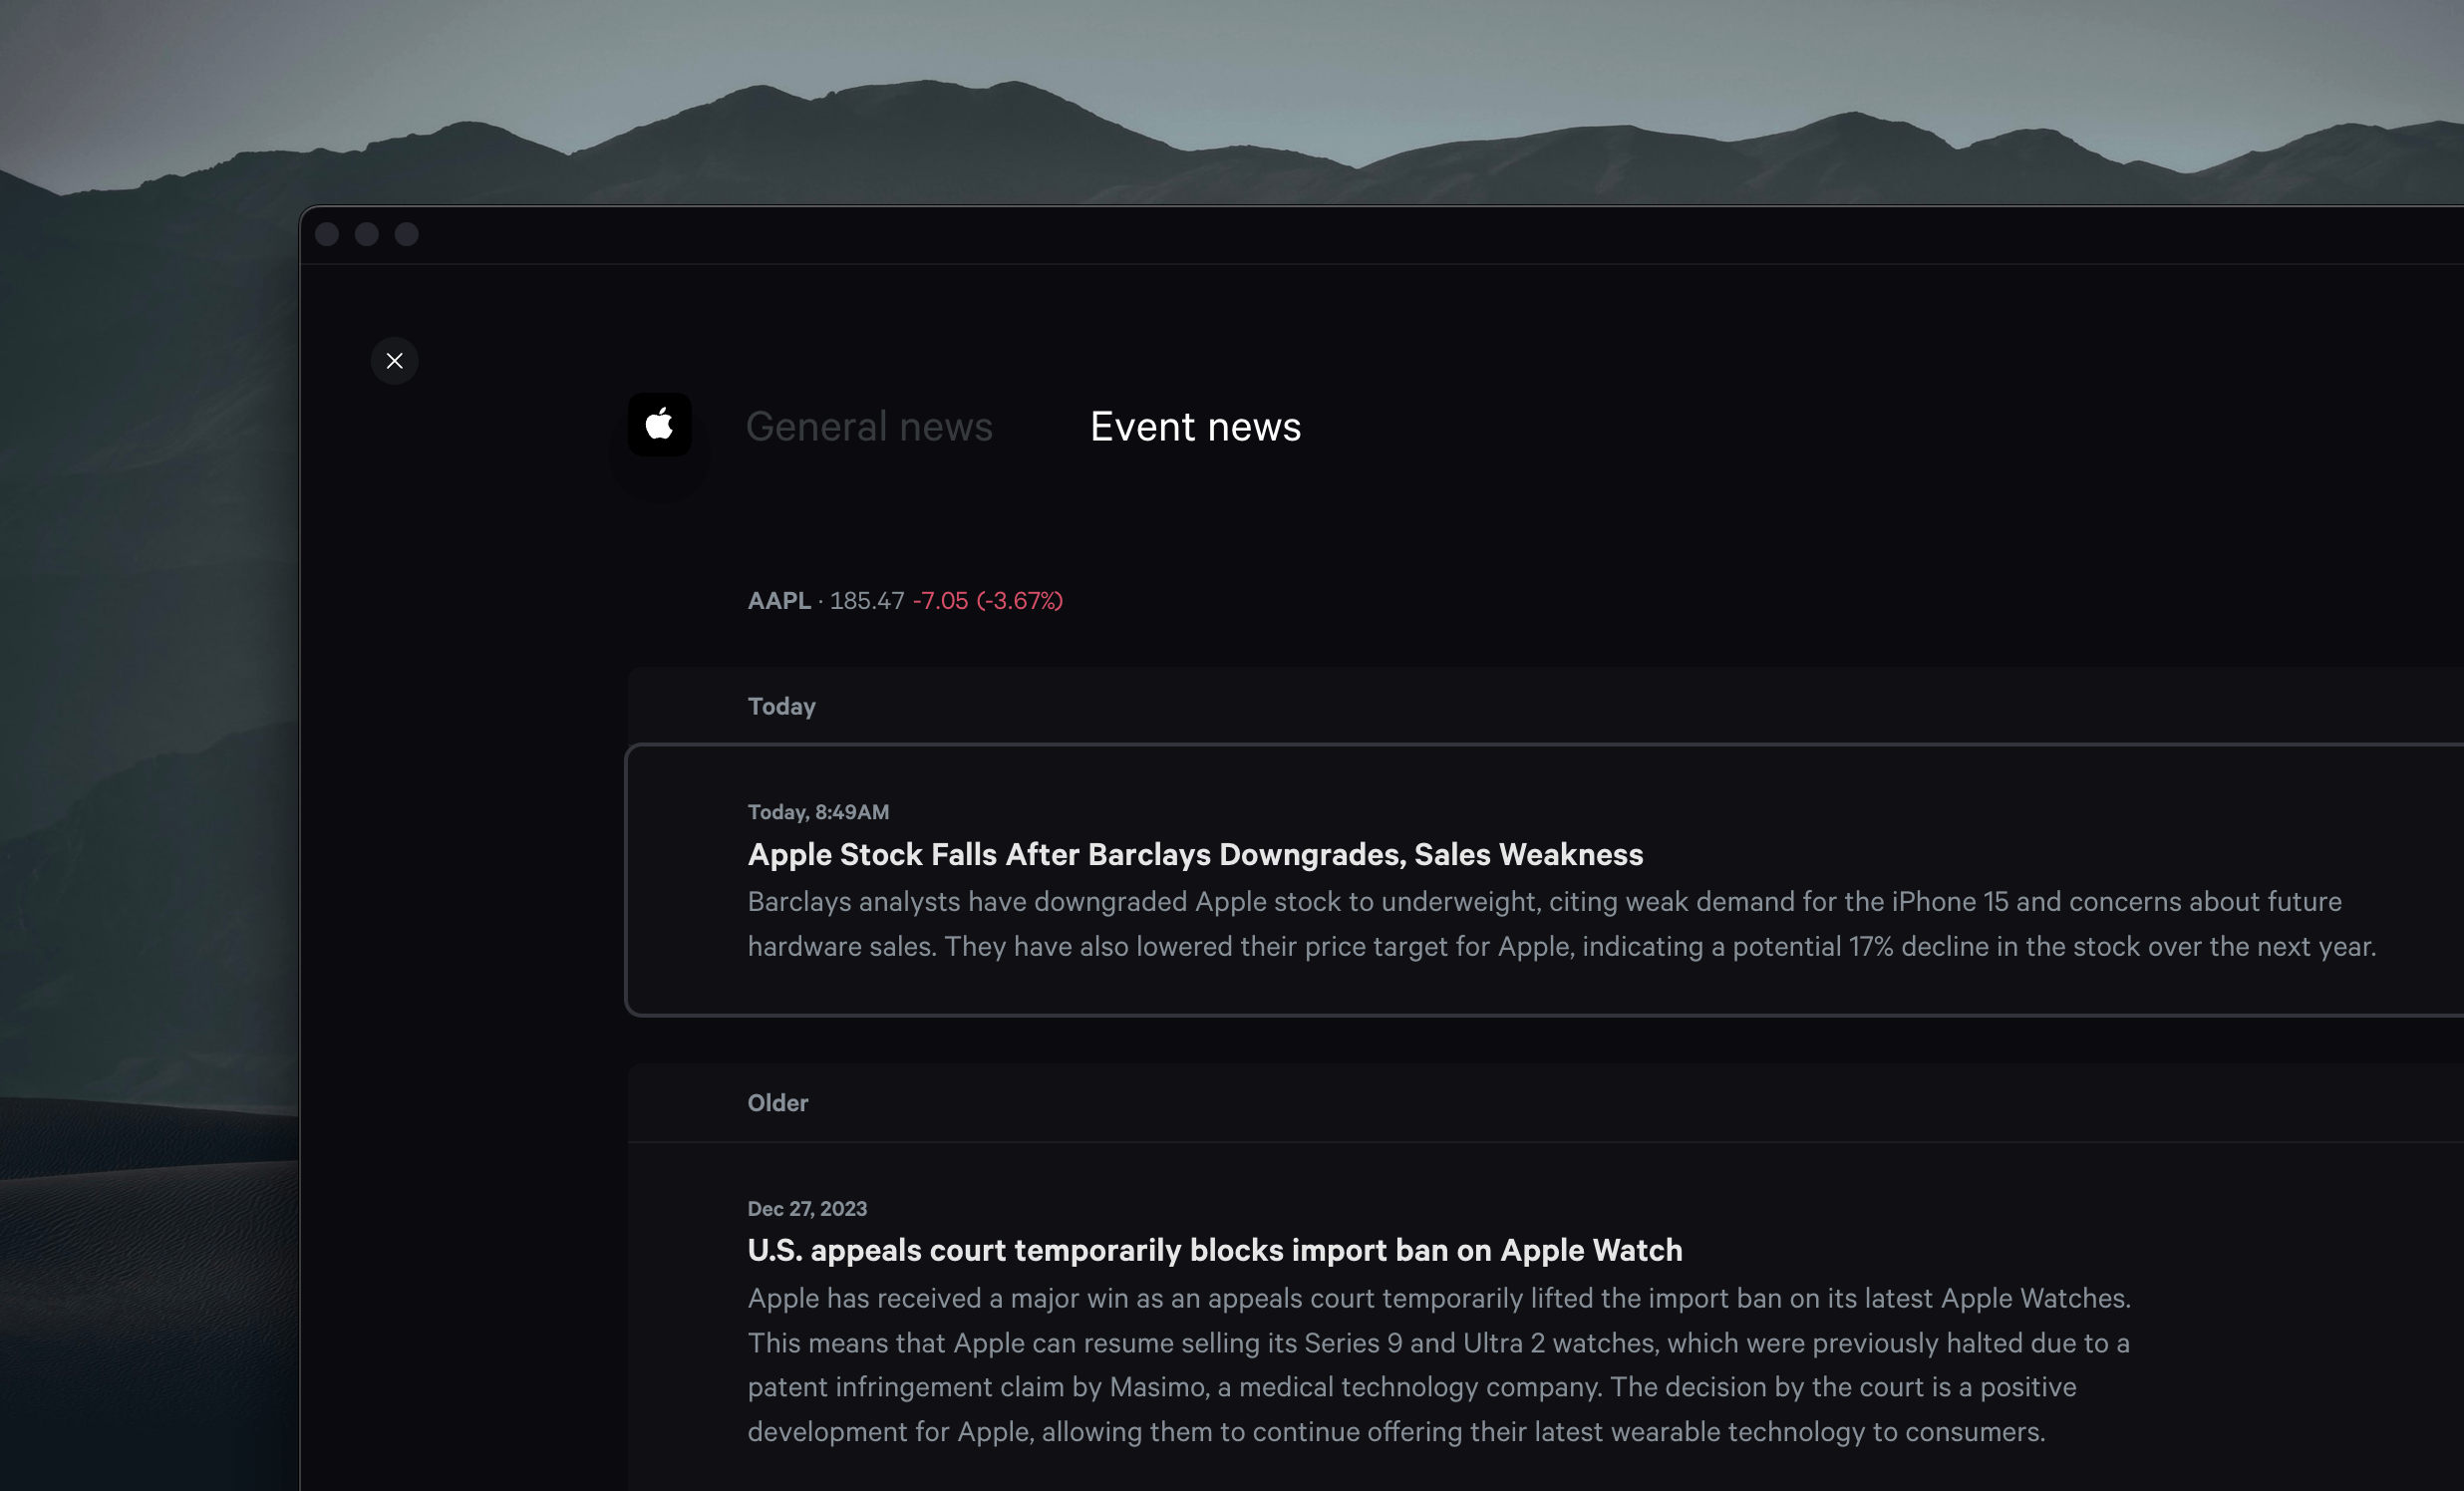
In our quest to continually improve your news-reading experience, we're excited to announce significant enhancements to Fey's news section. With a focus on precision and efficiency, we've reworked the general news tab and introduced an "Events News" feature.
What's New?
- Revamped general news tab: Enjoy a cleaner, more legible interface designed for quicker scanning and better understanding at a glance.
- Events News: Get the full picture of significant events, which condenses numerous headlines into a succinct, informative paragraph.
- Interactive Headlines: Dive deeper into stories that pique your interest with clickable sources, leading you to comprehensive articles from various news outlets.
We're committed to not just keeping you informed but enhancing the way you consume news. With these updates, Fey continues to redefine the standard for news aggregation and presentation.
Introducing Analyze: You can now read SEC filings in just 2 minutes, without missing any key information.
We've all been there — sifting through lengthy and tedious SEC filings, with some (including myself) often skipping them. Recognizing this challenge, we're excited to roll out "Analyze", a feature that simplifies this process, delivering the core insights in a succinct, 2-minute read.
AI output organization
- Consistent structure for every summary;
- Headlines offer a quick snapshot of the main message;
- Segments like Revenue, Strengths, Challenges, and Noteworthy Points are clearly defined for easy comprehension;
- The Final Summary ties everything together, ensuring a comprehensive understanding in a concise format.
This feature is tailored for efficiency and ease of use. We've ensured that every piece of essential information from the 10-Q files is included, yet organized in a manner that's consistently easy to read and understand. This approach aims to encourage more people to develop the habit of reading such important files.
Looking ahead, “Analyze” will continue to expand while keeping its core simplicity in mind. We’ll soon be rolling out news digests, peer analysis, and more — always focused on providing simple, quick, and accurate insights.
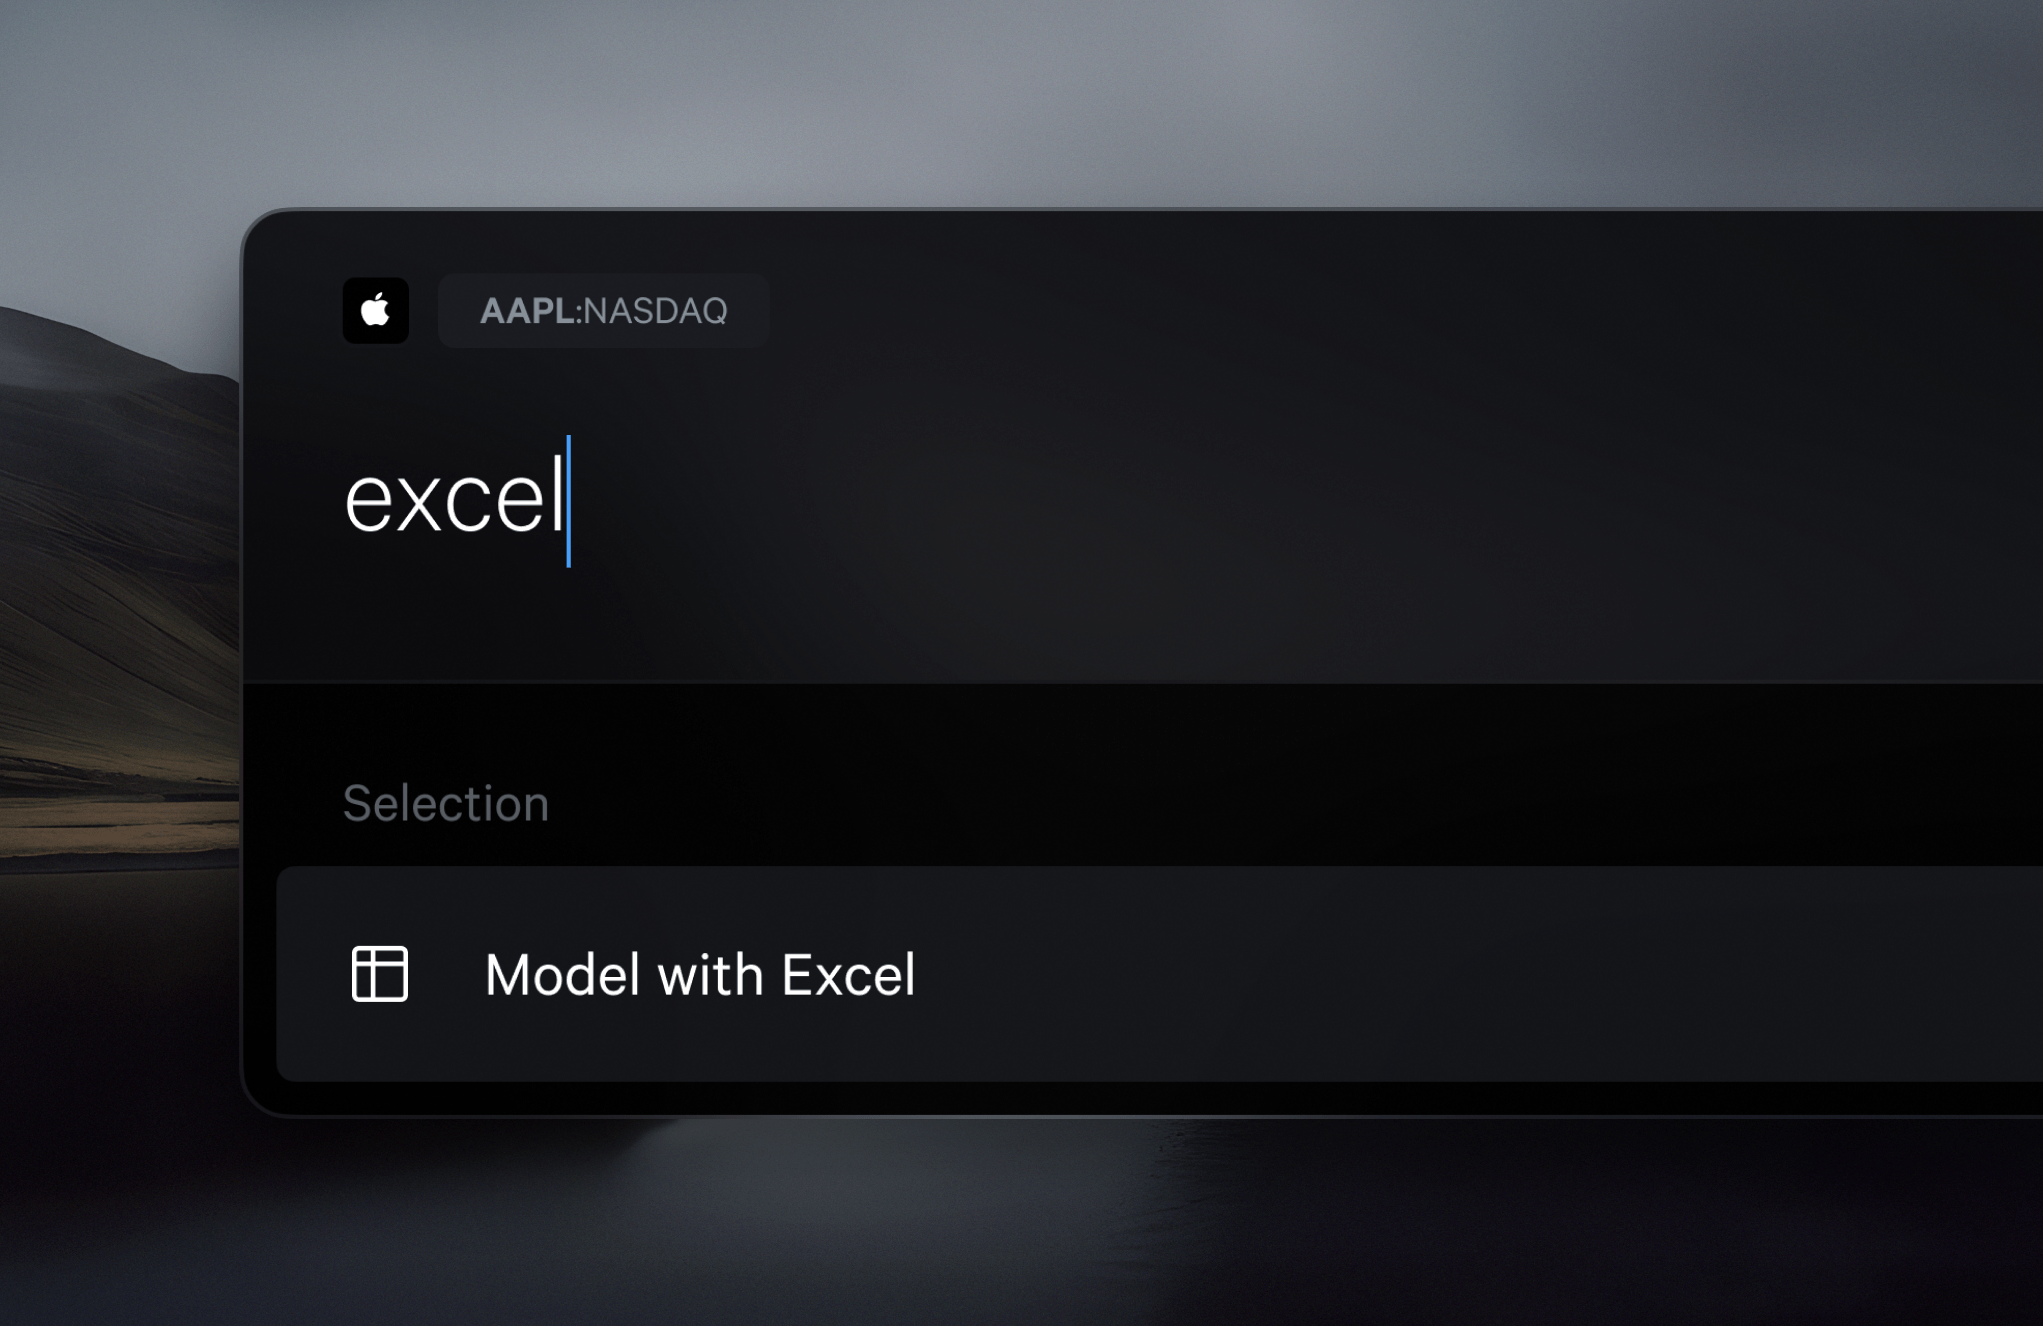
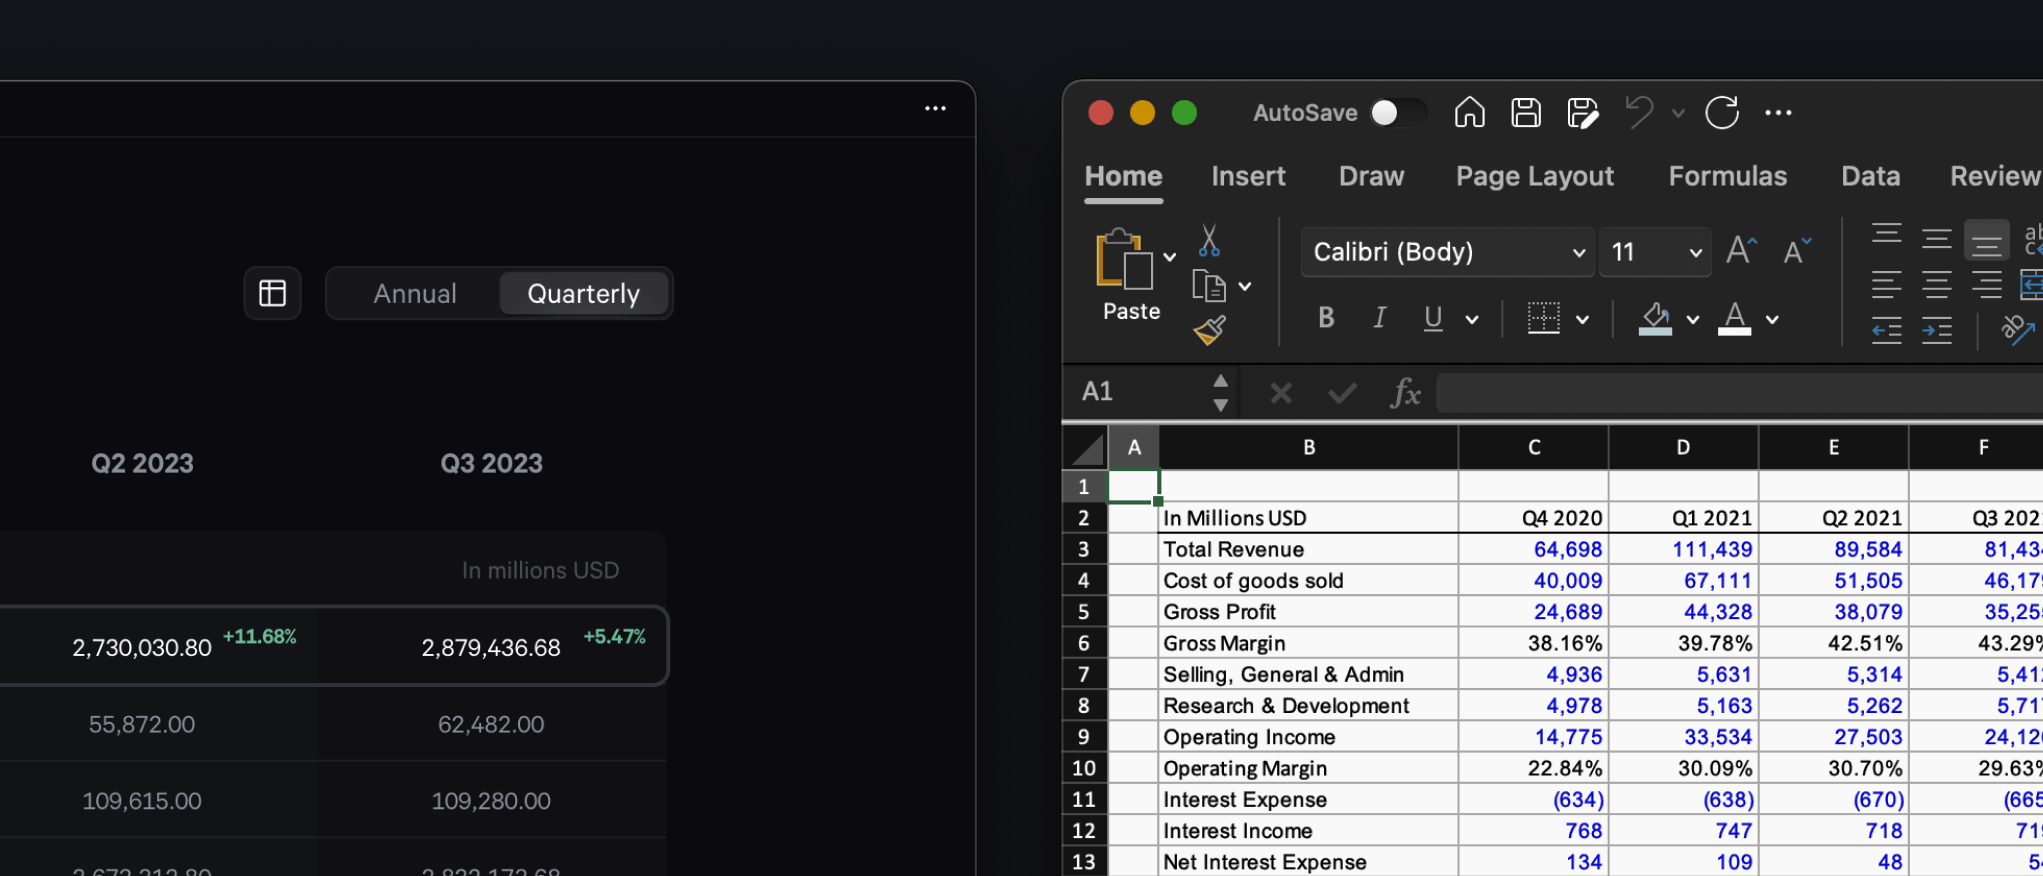
Fey now lets you Model with Excel, offering one-click exports of automated historical data and pre-calculated financial metrics for streamlined analysis.
What's new
Understanding that in-depth financial modeling requires both accuracy and efficiency, this update aims to improve your workflow. We’re introducing “Model with Excel,” designed to automate data preparation so you can focus on making informed financial predictions.
Here’s what’s packed into this update:
- One-click data export: A single keypress will generate an Excel file filled with the company’s income statement history, spanning multiple quarters or years.
- Pre-calculated metrics: Save time and reduce error with pre-calculated standard metrics such as Gross and Net margins.
- Analyst estimates integration: To assist in your forecasting, the exported Excel file will include estimates from financial analysts.
- DCF-ready: The data and calculations are organized for easy integration into your discounted cash flow models.
To use this feature, simply hit ⌘K and look for "Model with Excel," or navigate to any financial page and click on the Excel icon located in the top-right corner.
We've given our Watchlist a major overhaul, drastically improving customer experience and delivering more flexibility.
What's new
- Craft custom lists: Now, you have the power to create personalized lists tailored to your preferences and investment strategies.
- Manual symbol sorting: Take control of your watchlist by manually sorting symbols as you see fit, providing you with a more intuitive organization.
- Select multiple items: We've made it easier for you to manage your selections. You can now select multiple items simultaneously.
- Performance-based sorting: Enhance your decision-making with the ability to sort items by their performance metrics, giving you quick insights into your investments.
- Undock as a standalone widget: One feature that truly sets this update apart is the ability to undock the watchlist and use it as a standalone widget. Customize your workspace to suit your needs.
But it's not just about features; we've also fine-tuned the user experience. It's now keyboard-friendly, allowing you to effortlessly navigate between windows with a simple press of the W key. Plus, you can access stock information, news, and financials directly from the widget.